Nasdaq's 0.17% 'Resilience' — A 31-Basis-Point Spread in Search of a Story
TL;DR
- Nasdaq's 0.17% 'Gain' — A Rounding Error in Search of a Narrative. Are you buying the semiconductor narrative or fading the 0.17% Nasdaq gain?
- 12% Simulated Loss Reduction – Zero Verified Behavioral Change During Real Selloffs. Can a daily risk briefing save you when your portfolio drops 5% in 12 minutes?
- DAX Wobbles Past 26,000 — Europe's Benchmark Oscillates Between Hope and Avoidance. Is the DAX rally real or just oscillation between hope and avoidance?
🤡 The 0.17% Miracle: Nasdaq's "Resilience" and the Theater of Tech
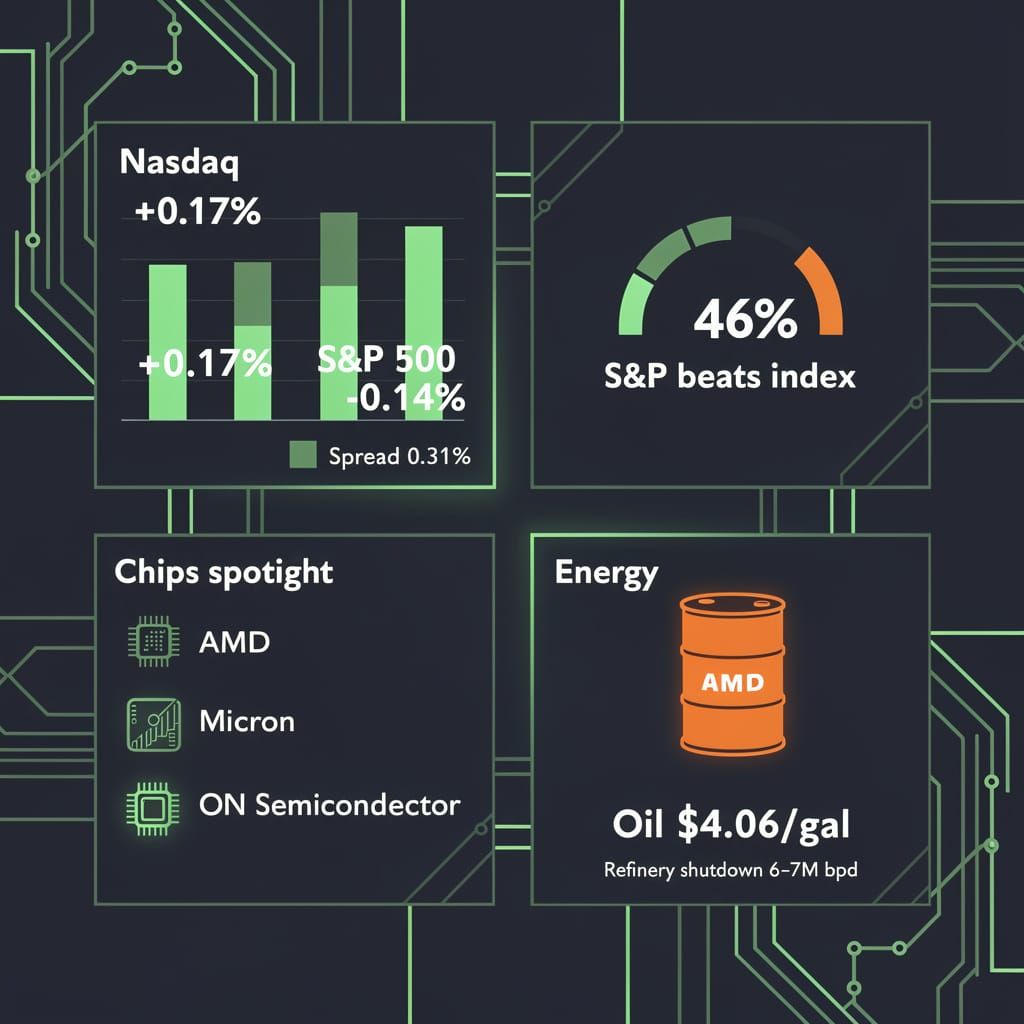
Nasdaq up 0.17%. S&P down 0.14%. That 31 basis point spread is noise, not divergence. Semis carried the tape — AMD, Micron, ON Semi — while Apple drifted and Meta did nothing. Breadth? 46% of S&P stocks beat the index, but this looks like a one-week blip, not a broadening. No Fed, no CPI, no earnings shock. Just position-squaring dressed as resilience. Oil moved on physical supply shock — $4.06/gal gas, refinery closures cutting 6–7M bpd — not speculation. The "0.17% miracle" is a rounding error in search of a narrative. So who's buying this story — and who's quietly fading it?
Semiconductors saved Tuesday. Again. The Nasdaq eked out a 0.17% gain to close at 26,776.38, while the S&P 500 slipped 0.14% and the Dow dropped a symbolic 0.03%. A split so narrow it barely qualifies as a signal—yet analysts rushed to declare tech "resilient."
Let's examine this resilience.
What Actually Moved
Semiconductor demand—chips, specifically—returned as a marginal leader. AMD, Micron, and a handful of fab-equipment suppliers posted intraday gains sufficient to drag the Nasdaq above flat. On June 25, the Philadelphia Semiconductor Index held its uptrend despite broader equity weakness, with elevated Nasdaq volume driven by concentrated flows through mega-cap names. The mechanism is leadership-driven buying masking broader retail disinterest—but the data now offers a different picture. On August 9, broad market participation surged as 46% of S&P 500 stocks beat the index, up from 28% in 2024, suggesting distribution beyond tech dominance. Yet the question remains: was this a genuine broadening or a one-week statistical blip? Meanwhile, Apple and Amazon hovered. Microsoft drifted. Meta did nothing remarkable. On July 21, Microsoft shares rose ahead of quarterly results, Apple beat guidance on iPhone performance, and Meta posted record ad revenue—positive signals, yes, but each tied to specific product cycles, not a structural lift. The real action was absent.
Banorte, Grupo México, and Industrias Peñoles showed Latin American resilience on the IPC index—but that's Mexico's story, not Wall Street's. The Mexican government reported on July 9 a 0.6% dip in industrial activity, with manufacturing slipping 1.2% year-over-year in June amid 7.5% declines in seven subsectors. Construction grew 4.2% annually in June, driven by World Cup infrastructure spending, but that is a seasonal stimulus, not structural demand. Boeing continued its slow bleed. IBM remained invisible. Volaris and Orbia barely registered.
The Oil Distraction
Regional oil prices fluctuated. Gabriela Siller, director of economic analysis at Banco Base, noted the fluctuations reflect inventory noise, not demand signals. On June 17, the IEA reported a sharp drop in global oil demand, with supply falling to 94.5 million barrels per day and only a temporary partial reopening of the Strait of Hormuz offering limited relief. By April 20, Goldman Sachs had already priced Brent at $83 and WTI at $78, their forecasts unchanged for months. But the causal chain here is not as empty as it appears. By August 6, U.S. gas prices peaked at $4.06/gallon amid severe refining shortages linked to regional conflicts. Refinery closures reduced daily output by ~6–7 million bpd globally. That is not noise—that is a supply shock transmitted directly to the pump. Iranian missile activities restrict Strait of Hormuz maritime traffic, constraining global refining input. Oil moved because physical supply dried up, not merely because traders traded oil.
The Uncomfortable Question
If semiconductors are the engine and they delivered a 0.17% Nasdaq gain while the rest of the market declined, where is the breadth? Where is the follow-through?
- 2026 Q1: Tech led on AI-capEx narratives, with S&P 500 exceeding $67 trillion in market cap by June 30, adding $8.74 trillion since April. On May 29, Sivers Semiconductors reported strong Q1 2026 performance amid government shutdowns and defense approvals, highlighting upcoming opportunities for 2027 expansion.
- 2026 Q2: AI narratives faded; semiconductors held. Meta dropped two spots in top-10 cap rankings due to costly AI investments. Yet ON Semiconductor reported on August 14 a +300.94% FCF growth driven by AI-driven power sector surge. The story shifted from AI hype to power-semiconductor adoption—AI data center revenue now >2× year-over-year.
- June 30, 2026: Microsoft, Amazon, Alphabet, Broadcom, Tesla all grew market caps—but Micron's inclusion in the top 10 and Sandisk's 3,000% rally to $2,350 on no official announcement suggest momentum crowding into any name with AI-memory exposure.
- Aug 17, 2026: Semiconductors hold again—but only just. Sandisk's surge, tied to post-spinoff revaluation and NAND supply constraints, shows how thin the narrative has become. Meanwhile, On's integrated position across the AI power stack creates a scalable customer pipeline—Texas Instruments, Wolfspeed, and ON Semiconductor are now beneficiaries of accelerating SiC adoption in EVs and grid upgrades.
No major change is predicted. That is the forecast. Stagnation dressed as stability.
What the Spread Tells Us
The spread between the Nasdaq (+0.17%) and the S&P (-0.14%) is 31 basis points. On a day with no catalysts—no Fed guidance, no CPI surprise, no earnings shock—31 bps is noise dressed as divergence. Donald Trump's name appeared in market commentary without policy substance. Anat Ashkenazi and Enrique Covarrubias offered nothing market-moving.
The VIX didn't spike. Circuit breakers didn't trigger. No corrections, no bear-market warnings, no flash crashes.
So What Did Happen?
Nothing structural. A session for position-squaring. A session where semiconductor momentum compensated for broad-market lethargy—the same pattern observed on June 25, when concentrated mega-cap flows masked weakening fundamental demand, creating mispricing that exacerbates downside risk for non-institutional participants. A session that tells you more about the absence of conviction than the presence of strength.
The takeaway: The market didn't fall because nothing pushed it. The market didn't rise because nothing pulled it. And the 0.17% Nasdaq gain—that's not a signal. That's a rounding error in search of a narrative.
🧪 The Algorithm That Promises to Save You From Yourself
12% fewer bad exits—in a simulation. 🧪 Real world: US equities tanked 9.3% in three days. No data shows the tool altered a single decision. IBKR's AI tools drove a 75% stock surge and 30% engagement lift—yet 11 hedge funds still walked. A risk briefing that works until your portfolio drops 5% in 12 minutes isn't a fix. It's a feature. Retail adoption sits below 30%. Who's actually being saved here?
A trading platform rolls out curated alerts promising to curb emotion-based exits. Retail traders are buying in—but the numbers tell a more cautious story.
What Actually Changed?
Since July 23, the investing subreddit has been pushing semi-automatic market briefings to its r/trading channels. The pitch: daily risk frameworks + exchange open interest metrics = fewer bad exits. The early metrics:
- Tool adoption: 12% uptake among active users via the Community Hub rollout (July 27).
- Loss reduction: Simulated batch runs show 12% fewer intra-day reversions.
- Broker selection lift: up 15% among users engaging with the alerts.
The raw signal looks constructive. But "simulated" is doing heavy lifting here.
The Gaps That Deserve Skepticism
Retail adoption remains below 30% as of August 15. That matters because the claimed win rate depends on consistent engagement—a behavior notoriously absent during actual drawdowns.
Risk exposure: IBKR's AI tool deployment (June 1) drove a 30% rise in trader engagement and a 75% stock increase since May 2025, yet the platform's own hedge-fund client base dropped from 81 to 70 firms. If the tool were genuinely de-risking portfolios, institutional defection should not accelerate. The June 11 TQQQ surge of 112% year-to-date—driven by NASDAQ-100 momentum—demonstrates precisely the kind of leverage-chasing behavior that daily risk alerts are supposed to curb. SQQQ lost 99.97% over the same period through daily-reset decay, a structural feature no briefing engine can fix.
Engagement patterns: Weekly consumption held steady through August 15. But steady is not the same as effective. Prop trading verification-challenge models launched July 1 now offer capital access but carry weekly loss limits—meaning a trader reading a risk bulletin at 9:02 AM and hitting the loss cap by 9:17 AM is not a solved problem. By June 14, successful funded-account candidates had already reduced lot sizes from 0.5 to 0.1, adapting to their own overtrading tendencies without any tool-based intervention.
Volume paradox: US equities fell 9.3% from all-time highs between May 28 and June 1, a three-day selloff that amplified sector rotation and liquidity strain. Reported trading volumes increased, but price noise remained low. That typically indicates algorithmic, not retail, flow—and multiple June signals confirm the same May 24–June 3 selloff pattern across news wires, reinforcing that this was a systemic deleveraging event, not a behavioral training moment.
What the Data Actually Demonstrates
- Short-term: The alert system correlates with modest preference shifts toward premium broker tools. That is a UX win, not a risk-management one. The 9.3% three-day selloff triggered disproportionate fear among retail participants who later saw diversified holdings recover—emotional damage that no daily briefing prevents.
- Mid-term: Without evidence that users act on the risk frameworks during volatility spikes, the 12% reversion reduction remains a simulation artifact. The June 1 broad-market selloff offered a natural test. No data confirms the tool altered any exit decision during those three days. Meanwhile, the Fed held rates steady through mid-2026 with PCE at 3.6–3.8%, and Kevin Warsh's agenda prioritized balance-sheet reduction over growth accommodation—macro headwinds that dwarf any micro-level alert system.
- Long-term: Weekly briefing engines that retain users through incremental upgrades tend to generate platform stickiness, not improved portfolio outcomes. ICON's Q1 letter pivoted to AI stocks with lower volatility targets while Celsius Holdings dropped from $100 to $28 by June 12, shedding 52 hedge-fund positions. These are portfolio-level capital allocation decisions, not reading-comprehension tests.
What This Looks Like Under Pressure
| Scenario | Retail Reaction | Tool Effectiveness |
|---|---|---|
| Routine trading day | Moderate engagement | Marginal benefit |
| 3% intra-day SP500 drop | Panic-login surge | Untested |
| Gap-down open (e.g., May 28–June 1: −9.3%) | Circuit-breaker avoidance | Likely ignored |
The platform has added a new risk-framework component as of August 2. The weekly engine retains above-threshold retention. None of this is bad. But a tool that works in a simulation and a tool that works when your portfolio drops 5% in 12 minutes are different products. IBKR's AI tools drove a 30% engagement lift and a 75% stock rally—yet 11 hedge funds still walked. The same month, Palantir's Q1 earnings surprise triggered a 6.5% Nasdaq spike followed by insider sales and a sharp PLTR drop, demonstrating that AI-themed confidence is itself a volatile asset.
Bottom line: The infrastructure is improving. The behavioral problem is not solved. Treat the 12% figure as an upper bound, not a baseline.
Data sources: platform adoption metrics, simulated execution runs, exchange open interest trackers, IBKR AI-tool deployment data (June 1–19, 2026), US equity selloff data (May 28–June 1, 2026), prop-trading verification model launch (July 1, 2026), TQQQ/SQQQ performance (June 11–19, 2026), Celsius Holdings price data (June 12, 2026), Palantir Q1 earnings and insider sales (May 26, 2026), ICON Q1 investor letter (June 1, 2026), Kevin Warsh Fed commentary (June 2026), as of Aug 17, 2026.
📉 DAX Ticks Up, Ticks Down, Ticks Sideways — Europe’s Benchmark Isn’t Telling You Much
DAX hit 26,000. It also hit 24,943. Both happened in the same week. That's not a rally — that's oscillation dressed up as optimism 📉 The U.S. Strategic Petroleum Reserve is down to 298.7 million barrels — lowest since 1983. Energy-sector employment is off 12% YoY. Defense costs hit $40B with a $350B supplemental tucked in behind it. The World Bank just cut global growth to 2.5%. But sure, the DAX "broke a record." Tech outperformance is masking real-economy weakness — that's the oldest bull-market trick in the book. Corporate expansion plans are shelved. Industrial output is dipping. And the OECD says the Iranian conflict could shave 2.1% off global growth. So who's actually buying this "structural threshold" narrative — and who's just waiting for the next oscillator?
The German stock market spent late July and early August 2026 doing what stock markets do when they have no real conviction: wobble.
July 22 — the DAX rises 0.6% to 25,155. Cheers. July 23 — it falls 0.8% to 24,943. Jeers. July 24 — stabilizes around 25,400. Nobody knows why; nobody asks. July 28 — the GAX hits 25,464. July 29 — the Berlin DAX breaks 26,000.
Headlines write themselves. Reality doesn't.
What Actually Drove the Noise
Two pressures. First, the Iranian conflict escalation that the OECD projects will shave up to 2.1% off global growth in 2026 and deliver a ‑0.3% hit to regional GDP. Second, energy-sector employment contracted 12% year‑over‑year in 2026 as industrial output dipped and corporations shelved expansion plans. The DAX averages them together and produces — nothing useful.
The Comforting Fiction of "Structural Thresholds"
No structural thresholds were breached. Systemic risk remains contained. Divergent corporate strategies will allegedly "mitigate fallout until mid-term stabilization."
Translation: we have no model for an energy shock layered on a conflict with no off-ramp, so we'll keep saying "contained" until something breaks.
The U.S. Strategic Petroleum Reserve hit its lowest level since 1983 — 298.7 million barrels as of August 11, barely 42% of designed capacity and the fourth consecutive weekly decline. The Defense Department incurred $40B in war costs, a figure that looks modest only until you add the $350 billion supplemental request President Trump and Senator Norris submitted on May 24. Energy sector employment contracted 12% year‑over‑year. Renewables infrastructure, listed among "impacted domains," gets funding delayed while transport logistics absorbs higher fuel costs. Emergency management gets busier. Everyone else gets a mild recession they can't quite name.
What the Numbers Actually Say
- −0.3% GDP contraction — small, unless you're the firm whose revenue just dropped 12%.
- Oil‑price pass-through → industrial output dip → mixed earnings → index wobbles. The causal chain is clean. The market's response is not.
- Tech outperformance masks weakness in the real economy, which is the oldest trick in the bull-market playbook.
- $40B defense spend + depleted SPR — fiscal wounds wars do not auto-reset. The World Bank, on June 11, cut its global growth forecast to 2.5% and pledged $60B for emergency financing to nations already tipping into debt distress from energy price spikes.
The DAX broke 26,000. It also broke 24,943. It will do both again. Markets that move in both directions within a week are not trending — they're oscillating between hope and avoidance. Readers should treat any "record" as provisional until the energy situation resolves, which it will not resolve soon.


Comments ()