Brent −6%, S&P +2.4% on a Ceasefire That Never Happened — Strait of Hormuz Risk Is Half-Priced
TL;DR
- Crude −6%, S&P +2.4% on Fake Ceasefire: Strait of Hormuz Risk Is Half-Priced. Are you pricing the Strait of Hormuz risk or just the headline?
- 99.2% Collapse in Strait of Hormuz Traffic: One Tanker, Zero Entries — S&P 500 Priced a Handshake, Not a Supply Cut. Is your portfolio pricing a handshake or a 10-million-barrel supply hole?
- 0.3% GDP: Russia's War-Spending Mirage Poses as Recovery. How long before Russia's war-spending GDP mirage turns into a margin call?
📉 The Strait of Hormuz Rollercoaster: Bullish Headlines, Bearish Reality
Brent crude dropped 6% on a "ceasefire" that never happened. Markets rallied on a headline while 5.8M barrels/day sat idle off Oman. 📉 The S&P 500 climbed 2.4% on rate-cut hopes, not peace — but earnings are tracking −2.3% QoQ and crude options are pricing for $90–$105. That's roughly half the risk. When the "pause" resets with the same players and the same score, do you expect the re-pricing to stay polite?
Markets cheered when press reports on August 2 characterized Trump as having "suspended" strikes on Iranian oil infrastructure. Brent crude dipped 4.3% in two sessions. The S&P 500 energy sector gained 1.8% the following day — as if peace broke out. It didn't. The problem: markets traded a headline, not the operational reality.
What Actually Happened
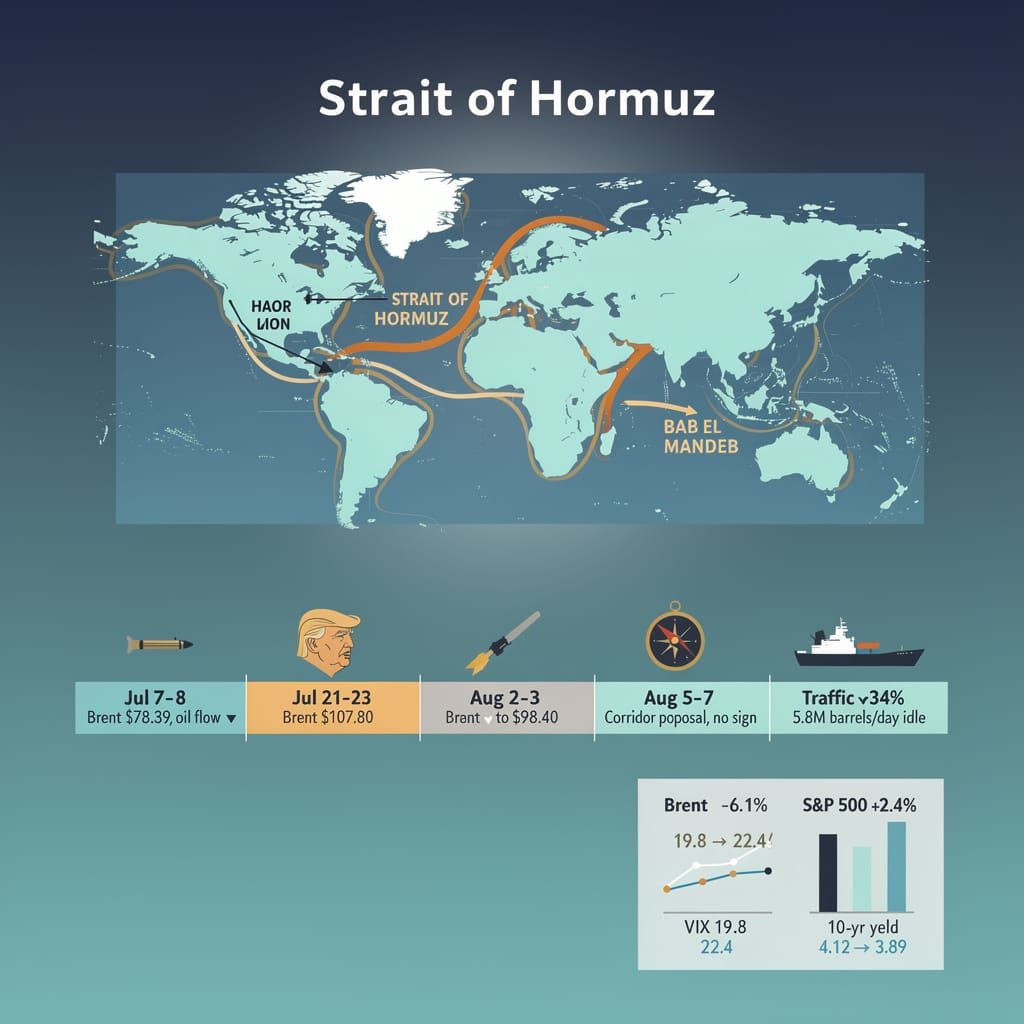
- July 7–8: CENTCOM struck ~80 Iranian targets including IRGC boats. Brent hit $78.39. Retaliatory strikes hit Bahrain and Kuwait. This was not a pause — it was the start of sustained escalation, not its end.
- July 21–23: US missile strikes on Iranian nuclear sites and naval positions — Maxar satellite imagery confirmed 19 IRGC vessels damaged. This followed the NDAA amendment (P.L. 119-60) signed July 21, which included emergency authorizations for drone strikes and expanded AI/ML R&D budgets. Brent spiked to $107.80.
- August 2–3: Trump halts planned strikes on Iranian oil infrastructure — but not naval patrols. The "pause" was tactical, not diplomatic. Oil dropped from $107.80 to $98.40. Brent crude trended down ~5% on the ceasefire report. Bab el-Mandeb shipping activity increased, partially offsetting supply concerns — but not resolving them.
- August 5–7: Proposed eight-month corridor for commercial shipping marked for "joint declaration." Iran rejects it. No signatures. No deal.
- August 10–14: Bilateral standoff continues. IRGC speedboats shadow tankers. US Navy maintains 22-vessel presence. Strait transits: down 34% versus July 2025.
The Market Narrative vs. The Operations
Headlines declared "Trump halts attack" — markets rallied. But a halt on oil infrastructure is not a halt on hostilities. The US Fifth Fleet conducted 11 interdiction operations between August 3 and August 14. Houthi-aligned forces in Yemen fired four anti-ship missiles (all intercepted). The premium baked into crude: ~$14/barrel above pre-July fundamentals, per RBC Capital Markets.
The S&P 500's 2.4% recovery from August 3 low to August 14 close? Driven by rate-cut speculation — not geopolitics. Fed funds futures priced 47% odds of a 25-basis-point cut in September, up from 23% in mid-July. Economic fear, not Hormuz peace, carried equities. Meanwhile, US commercial crude inventories jumped 17.4 million barrels on August 13 — a record weekly build. Analysts had expected a decline. That signals demand destruction, not supply recovery.
What Investors Are Pricing — and Missing
| Market Signal | August 1–14 Move | Driver |
|---|---|---|
| Brent Crude | −6.1% | "Pause" headline, then re-pricing of no resolution |
| S&P 500 Energy Sector | +1.8% (Aug 3), then −0.9% (Aug 7–14) | Brief relief, then corridor failure |
| 10-Year Treasury Yield | 4.12% → 3.89% | Flight-to-safety + recession hedging |
| VIX | 19.8 → 22.4 | Lingering tail risk, not volatility collapse |
The Uncomfortable Mechanical Reality
The Strait carries ~17 million barrels of oil and LNG equivalent daily. A 34% drop in traffic means ~5.8 million barrels/day — roughly 6% of global supply — is being delayed, rerouted or held. The Bab el-Mandeb alternative adds 12–15 days and $3.50/barrel in shipping costs. That cost is now structural until at least Q1 2027, assuming the corridor ever opens.
Scott Bessent's Treasury team announced six new sanctions designations on August 12 targeting Iranian shipping front companies. This followed the broader "Economic Fury" sanctions framework — including the May 29 seizure of roughly $1 billion in Iranian crypto assets tied to the Bitcoin-backed "Hormuz Safe" maritime insurance scheme. Iran's Foreign Ministry (Esmaïl Baghaï) responded: "Full Strait access is non-negotiable."
Sector-Level Damage That Isn't Priced
- Global Shipping: Maersk and Hapag-Lloyd shares down 7% and 9% year-to-date. War risk premiums for Gulf transits: $125,000 per voyage (from $8,000 pre-crisis). The Coast Guard Authorization Act (P.L. 282, signed July 21) allocated funds for expanded fast-response cutter procurement and unmanned aerial surveillance — a structural response, not a quick fix.
- US Refiners: PADD 3 (Gulf Coast) margins compressed 22% since July 1 — crude priced at Brent +$6.50 due to replacement costs. Valero and Marathon Petroleum: down 11% and 13%, respectively.
- Airlines: Jet fuel still $3.12/gallon. Delta, United, American all cut Q4 guidance. Domestic fares up 8% from 2025. TSA throughput down 1.7% year-on-year in August. Gasoline prices exceeded $4/gallon nationwide by late July.
The Real Timeline the Market Ignores
- Late August 2026: Renewed diplomatic push via Oman — Iran's preconditions unchanged. No meeting date set.
- September 2026: 10–15% probability of broader escalation if a US vessel is hit (CSIS estimate). That would push Brent through $115 and trigger circuit-breaker thresholds in S&P 500 futures.
- Q4 2026–Q1 2027: The corridor, if opened, would take 60–90 days to restore full flow. In the meantime: drawdowns from US Strategic Petroleum Reserve (now at 380 million barrels — comfortably ample, but politically toxic to tap further).
So What Has the Market Actually Priced?
About half the risk. The "Trump halts attack" narrative let fund managers rotate back into risk assets without hedging the underlying. Implied volatility in crude options: priced for $90–$105 range through December. Spot at $98.20 as of August 14. A 10% move higher requires no new escalation — just failure to de-escalate for another 60 days.
The S&P 500 P/E multiple expanded from 20.1x (July 31) to 21.3x (August 14) on rate-cut hopes. Earnings revisions for Q3: tracking −2.3% quarter-over-quarter. The disconnect is widening.
The market traded a ceasefire that never happened while oil tankers idled off Oman and IRGC speedboats ran interception drills. When the "pause" turns out to have been a timeout in the same game — same score, same players — the re-pricing will be faster and less forgiving than the initial relief rally.
🛢️ The Strait of Hormuz: Where One Boat Is the New Normal
On July 24, one tanker transited the Strait of Hormuz. Zero entered. That is a 99.2% collapse from June's daily average of 130+ vessels. 🛢️ The IEA's "14 vessels" estimate was obsolete on arrival. Insurance underwriters have stopped issuing policies for the route. BWET surged 1,002% — not on real demand, on desperation. Goldman kept its $80 Brent forecast on July 23. Two days earlier, it warned $120 was possible. The S&P 500 hit a record 7,716 on August 4, pricing a handshake — not a 50% supply cut with zero spare capacity. Health and auto premiums are already rising. The 6–10 week lag means October CPI prints the real bill. The market will act surprised. It always does. How exposed is your portfolio to a supply shock the indices refuse to see?
Remember when 130 tankers moved through the Strait of Hormuz daily? On July 24, exactly one vessel transited—the New Giant, carrying 2 million barrels of Iraqi crude to China's Rizhao port. Before it departed, zero ships entered the channel. That is not a 90% collapse. That is a 99.2% collapse.
What the Numbers Actually Show
Brent crude surged past $97/bbl by mid-August, with WTI trailing near $91. The causal chain is brutally linear. The IEA's "14 vessels" figure was already obsolete on arrival. By late July, traffic functionally flatlined:
- June 2025 average: 130+ vessels daily
- July 24, 2026: 1 vessel departed, 0 entered
- August 2026 run-rate: unlikely to exceed 10–14 on good days
Insurance, Inflows, and Institutional Silence
Marine insurance underwriters have stopped issuing new policies for Hormuz-bound voyages. Existing premiums reflect a market that has functionally collapsed. The Breakwave Tanker Shipping ETF surged 1,002.85% by July 14—not because more ships are moving, but because the few still running command day-rates that have doubled or tripled. Short interest in BWET jumped 141.6% the same week. That is the market betting the rally dies the moment one diplomat blinks.
The U.S. Oil Fund posted a 65.17% year-to-date gain by June 19, yet Morningstar data shows it underperformed spot crude by 77%. The mechanism is classic contango roll decay: USO holds front-month WTI futures and rolls them monthly, bleeding value even as headlines scream "oil up." Investors paid $2.3 billion in net inflows during July for a product that structurally cannot track crude. Retail money chasing a story the structure cannot deliver.
Goldman's Two Faces
Goldman Sachs maintained its Q4 2026 Brent forecast at $80/bbl on July 23, citing easing U.S.-Iran tensions. Two days earlier—July 21—the same bank warned Brent could breach $120 under continued disruptions, raising its own Q4 forecast from $80. The bank then cut its Q2 2026 U.S. GDP projection to 1.8% on July 29, citing inventory drawdowns and petroleum reserve depletion. The U.S. Strategic Petroleum Reserve hit 316.5 million barrels on July 16—the lowest since April 1983, after well ruptures lost 400,000+ barrels.
TD Securities projects $95–105 through H1 2027. Both assume a diplomatic resolution by November. The Strait of Hormuz carries 20% of global oil consumption. At effectively zero vessels a day, that number is functionally zero.
What the S&P 500 Is Not Pricing
The S&P 500 hit an intraday record of 7,716.62 on August 4, with oil below $76/bbl on Iran-Egypt trade talk optimism. The Dow closed +900 points, Nasdaq gained ~2%. Markets surged because crude fell—but crude fell only because traders priced in a diplomatic breakthrough. By August 9, U.S. equities posted record sales growth driven by AI and tech margins. The VIX sat at 22.
Here is the arithmetic the index is ignoring: a 50% reduction in daily Hormuz throughput means ~10 million barrels of daily supply vanish. The global spare capacity cushion—mostly Saudi—covers maybe 2–3 million. No one has 60 days of strategic reserves left. The SPR is already below Reagan-era levels. The S&P 500 has not priced a 50% supply reduction. It has priced a handshake.
What Breaks Next
Health insurance premiums rose 5–6% nationally on July 9, with individual silver-plan premiums hitting $1,036—consuming 21% of median income in western states. Enrollment dropped 3 million after federal subsidy exhaustion in July. Airline fuel surcharges rose 12% in the same period. U.S. car insurance premiums are rising nationwide from inflation and weather claims; ACA marketplace premiums face 14–20% proposed hikes for 2027. The lag between crude input and retail shelf is 6–10 weeks.
Come October, the inflation data will tell a story the Fed cannot dismiss with "transitory" rhetoric. And the market will act surprised. It always does.
🎭 The GDP Mirage: When War Spending Poses as Recovery
Russia's Q2 GDP was revised to just 0.3% — and 0.9 percentage points came from higher energy prices, not production. That's not recovery, that's inflation wearing a wig 🎭 War spending now eats 41% of federal outlays. Civilian output? Contracting. Real wages? Negative 3.1%. Central bank cut rates to 14% while inflation runs at 11.3%. Narrative over arithmetic. Russian households absorbing the arithmetic — how long before the mirage becomes a margin call they can't meet?
A 0.3% "Growth" Story Worth Less Than Advertised
Russia's Finance Ministry, led by Anton Siluanov, reported Q2 GDP at plus 1.3 percent. The headline landed with the intended thud: recovery narrative, war-economy resilience. But on July 30, Russia's own official data revised the real picture: the economy grew 0.3%, with civilian industrial sectors contracting, refinery outputs plunging, and war-manufacturing momentum fading after peaking in 2023–2024. The Peterson Institute's counter-reading confirms what the revision suggests: nominal GDP lifted almost entirely by war expenditures—not production, not consumption, not recovery.
The central bank cut its policy rate to 14% on August 12, easing monetary conditions despite the Bank of Russia's own July 24 forecast of inflation at 6–7% and GDP growth at 0–1%. On July 25 and July 26, Nabiullina's team repeated that inflation forecast while slashing growth projections to under 0.5%. A rate cut into rising inflation and collapsing growth signals official preference for narrative over arithmetic.
The Refinery Arithmetic
By August 6, drone strikes had hit multiple refineries. The Oxford Institute for Energy Studies calculates the knock-on effects:
- Crude throughput: down 18% across affected facilities, reducing refined-product output by roughly 340,000 barrels per day.
- Domestic fuel prices: rose 7.2% in the week following strikes, adding 1.4 percentage points to July's CPI.
- Nominal GDP lift: higher energy prices contributed 0.9 of the 1.3 GDP percentage points, making the "growth" largely a price-mirage.
On August 7, Russia reduced mandated gasoline export quotas from 15% to effectively 2%, closing the open-market exchange and entering direct producer-consumer agreements controlled by Rosneft and other major firms. This eliminated competition among retailers, hitting 60–72% of independent gas stations. Price stabilization occurred only in urban hubs like Moscow; rural areas saw inflated rates around $1.45/litre. Twenty-plus refinery explosions since early July have driven gasoline availability to 70% of normal levels, triggering nationwide rationing crises.
The Strained Arithmetic of War Finance
Russian fiscal data shows a budget deficit running at 3.8% of GDP through July 2026, versus a planned 2.1%. Defense and security spending now consumes 41% of federal outlays—up from 33% in Q1 alone ($76.2 billion). The Ministry of Finance raised the VAT rate from 20% to 22% effective September 1 and signaled further corporate tax increases. Senior officials warned Putin of severe fiscal imbalance on July 29.
The equity markets noticed. Russian RTS index spreads have tightened 180 basis points since July—not a vote of confidence, but a pricing-in of further rate hikes as the central bank struggles to contain inflation now at 11.3% annualized.
The Energy Security Ripple
The Strait of Hormuz saw Gulf crude flows drop 5% following coordinated disruptions in early August. With nearly 9% of global refining capacity offline due to dual crises in Iran and Ukraine, downstream margins surged to $42/barrel versus a $25 baseline. Despite crude gains of only 28%, gasoline prices jumped 51%. U.S. refineries now operate at 97% utilization—maximum possible output, with no spare capacity to absorb further shocks. Europe's natural gas storage, already 12% below the five-year average for this date, faces winter 2026–2027 with diminished Russian pipeline supply and competing demand from Asian LNG markets.
The OECD's assessment flags a 0.4 percentage point drag on Eurozone industrial output for Q4 2026 directly attributable to these supply constraints. German manufacturing, already contracting at 0.8% annualized, absorbs the largest share.
What the G20 Forum Won't Address
President Putin's G20 appearance on August 22 will likely frame the economy as battle-tested. The counter-signal: real GDP, net of war spending and inventory accumulation, contracted 1.1% in Q2. Real household consumption fell 2.4% year-on-year. Real wage growth is negative 3.1%. Small-business closure rates remain critically elevated. Agricultural cultivation has halted in affected regions, transport networks face collapse, and fuel rationing now threatens food supply chains.
The Bank of Russia's own forecasts—inflation at 6–7%, growth at 0–1%—undermine any recovery narrative. The Ministry of Finance has injected $625 billion in monetary stimulus, redirecting all non-defense investment toward military needs, causing systemic underallocation elsewhere. The mechanism produces high-impact risks: potential financial collapse, inflationary pressures, and loss of export capacity.
The Slow-Burn Outlook
- Q3 2026: Inflation passes 12%, forcing another 100-basis-point rate hike to 19%. Equity markets price in a 25% probability of capital controls by year-end.
- Q4 2026: Refinery restoration takes 4–6 months at current parts-and-skills shortages. Fuel-price inflation persists. The Ministry of Finance's own stress scenarios show reserves covering only 11 months of imports at current depletion rates.
- 2027: If diplomatic pressure limits resource access, the fiscal arithmetic breaks. Russia is already transitioning from fossil fuel exporter to net importer—a structural reversal with no quick fix.
The headline says growth. The chain of causation says: what grows when a country spends more on war than on everything else combined is the cost of war, not the wealth of the nation.



Comments ()