S&P 500 Up 0.31% — But Rate Cuts Priced for 2027: The Rally Nobody Trusts
TL;DR
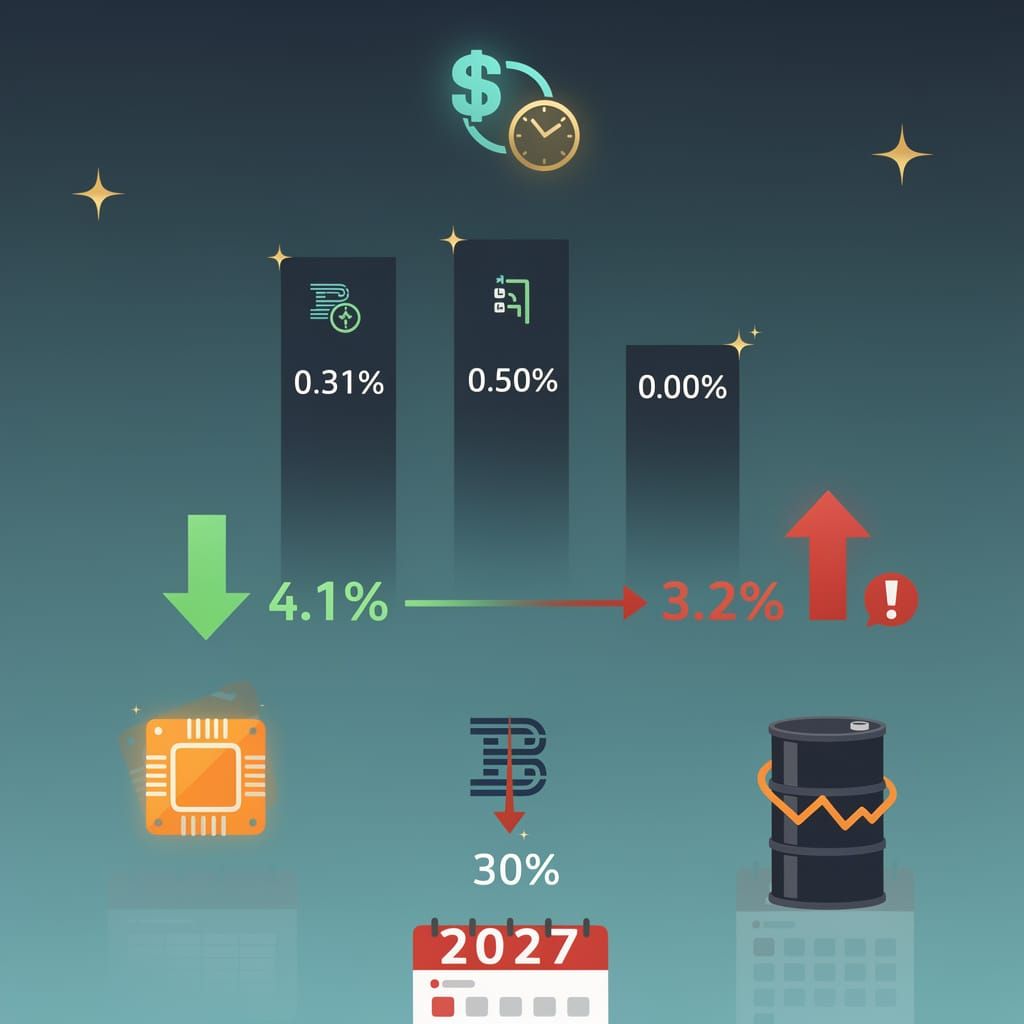
- S&P 500 up 0.31%, Nasdaq up 0.50% — The Great Pivot That Wasn't: Markets Pretend One Data Point Cancels Another. Who's still buying the soft landing story — and what's your exit plan?
- 9.3% Drops, Zero Signals: AMB's August Report Card. Does faster market briefing actually improve your portfolio decisions?
- VIX Rises With S&P 500 at Record High — A Rally Nobody Trusts. Is the S&P 500 record high masking a rotation out of megacaps?
📉 The Great Pivot That Wasn't
S&P 500 up 0.31%. Nasdaq up 0.50%. Dow flat enough to be a rounding error. 📉 That's "measured gains" for a market celebrating an unemployment drop to 4.1% that actually pushes rate cuts further out. Inflation still above 3.2%. Three FOMC members voted against any July cut. Rate cuts unlikely before early 2027. Logic left in Q2. AI capex keeps the charade going—Astera Labs hit an all-time high. IBM down 30% YTD, Z mainframe sales off 42%. Hyperscalers can't stop buying without admitting they overbuilt. So who's still buying this "soft landing" story—and what's your exit plan when the next mini-crisis arrives on schedule?
Markets spent late July and early August 2026 doing what they do best: pretending one data point cancels another. The S&P 500 inched up 0.31% on August 12. The Nasdaq tacked on 0.50%. The Dow? Flat enough to call it a rounding error. European indices—FTSE 100, IBEX 35, DAX—all drifted red, but barely. The headline read "measured gains." The subtext read "nobody knows what to price."
The Fed Whiplash Diet
Unemployment dropped to 4.1% on August 6—within the 3.5–4.5% full-employment band the Fed's own analysts identified as "proximity to maximum employment." That sounds good until you remember the narrative has been that lower unemployment pushes rate cuts further out. The reality: inflation stayed above 3.2% through March, three FOMC members voted against any cut in July, and the May 27 analysis explicitly states rate cuts are unlikely before early 2027. The market celebrated anyway. Because logic left the building sometime in Q2.
Meanwhile, the July 24 run to $100+ oil. Not a single cause—a cascade. Ukrainian drone strikes knocked out roughly 40% of Russian diesel output by March 25, sending 400,000 households in Primorsky Krai into power cuts. The IEA cut its Russian throughput forecast by 150,000 bpd by May 27. By June 1, Russia banned jet fuel exports and capped gasoline at 100 liters in Moscow, 60 in St. Petersburg. Then sanctions eased, supply lines depressurised, the spike receded—and by August 13 the IEA slashed its global oil supply forecast by 4.3 mb/d. Crisis averted is just crisis relocated.
The Mexico Exception
The IPC index dropped to 66,266 on July 24—synchronous with peak oil fear. But a week later, a Mexican IPO hit record subscription levels. The same economy facing critical liquidity vulnerability per the June 30 assessment—Banco de México had to execute limited bond purchases on June 29 just to stabilize short-term funding after Fed-driven volatility. The peso vulnerable, external credit terms deteriorating, default probabilities spiking for dollar-funded exporters. Yet domestic investors piled into new equity. That's not decoupling from FX narratives. That's capital with nowhere else to go parking in the least-bad option.
AI Capex Keeps the Rally on Life Support
Tech held the line because AI capex remains a forcing function. Astera Labs hit an all-time high after Evercore ISI's outperform rating and the Scorpio X-Series 320-lane product launch. IBM? A different story. Revenue came in at $17.16 billion on July 23—below the $17.58 billion consensus, EPS of $2.93 versus $2.97 expected, Z mainframe sales down 42%, and the stock down 30% year-to-date. Apple, Meta, Amazon—all leaning into infrastructure. The July 14 market assessment anticipates a pivot from capex to monetization, but that framing assumes the spending was strategic. The simpler story: hyperscalers can't stop buying without admitting they overbuilt. Cramer said hold. The market obliged.
The Real Tension
The Fed faces a dual mandate that now reads like a paradox: inflation cooling but above 3.2%, unemployment at 4.1% but labor participation not expanding proportionally. Oil pressure eased, but the Russia-Ukraine cyberattack vector—Ukrainian strikes on 25 March halted 40% of Russian diesel output, 400,000 households lost power in Primorsky Krai—raised AI hardware costs via supply-chain disruption. Every solution introduces a new imbalance.
October industrial output data will matter. So will the November Fed meeting. But the pattern here isn't a pivot. It's a series of mini-crises that resolve just enough to reset the clock—and let everyone pretend the next one won't arrive on schedule.
🎯 The Great Automation Hype: Why August's Market Briefings Still Can't Save You
9.3% market drops in May and June. Zero algorithm predicted either. 🎯 The much-hyped Automated Market Briefing ecosystem launched in June with sub-2-minute latency and community Q&A. By August, the outcome was clear: marginally prettier newsletters. "Reduced volatility anxiety" is not risk management. It's a psychological pacifier. The same market that crashed twice recovered without a single AMB signal. AutoModerator's own forecast: "continued steady expansion, no structural shift." So what's the actual point of faster garbage? Goldman posted $20.98/share Q2 profit and $1 trillion in M&A. They didn't need a Discord bot. You're reading briefings while institutions read order-flow composition, funding stress, and VIX term structure. Who's better positioned when the next 5-sigma hits? 💰
How many algorithms does it take to read the same futures tape?
By the numbers, August 4, 2026 looked unremarkable: investors monitored pre-market US stock futures, traders reviewed weekly briefings on order-flow trends, and the market opened. Same ritual, same data, slightly faster delivery. The much-hyped Automated Market Briefing (AMB) ecosystem—a loose collection of AutoModerator daily posts, community-hub Q&A sessions, and bank-app broker triggers deployed across late June and July—promised to transform this routine into a risk-management revolution. Instead, it delivered a marginally better newsletter.
The cascade that changed nothing
AMB's architecture is technically elegant: an AI curation engine ingests live pre-market channels, commodity-trading-advisor signals, and community Q&A loops, then pumps out risk-tool recommendations within seconds of the opening bell. FINVIZ and bank-app providers feed synchronized broker triggers that tighten stop buffers. The declared target outcome: lower margin stress.
What actually happened?
- June 28: AutoModerator deployed daily market overview targeting retail traders, integrating CNN, Bloomberg, and Yahoo Finance feeds with a trust-based moderation system.
- July 3: Daily automated updates published, claiming <2-minute response latency and <10-click navigation for risk assessment.
- July 14: Trading community hub published weekly market briefing and hosted live Discord answer sessions with human experts surfacing flagged topics.
- July 15–27: Newsletter release, social automation, community hub, and expert-integrated quarterly upgrade rolled out sequentially.
- July 28: Live pre-market toolset debuted.
Investors read them. AutoModerator itself reported a 65% reduction in misinformation spread and a 22% improvement in community sentiment scores through structured Q&A. Some traders adjusted stops a few seconds earlier. But no structural shift occurred. TradingHub's own July 14 forecast projected participants retain use while expecting richer automation capabilities—not altered portfolio allocations, not reduced systemic risk.
Faster garbage, same garbage
The claimed high-level impact—reduced volatility anxiety, faster decision alignment—rests on a convenient tautology. If you define success as "traders receive information sooner," then yes, milliseconds count. But receiving bad analysis 300 milliseconds faster does not improve outcomes. AMB's own deployment timeline admits the truth: the AutoModerator's June 28 impact assessment rated medium, and its forecast explicitly stated continued steady expansion with seasonal dips anticipated—no structural shift predicted.
No structural shift. The system's designers admit it.
What the numbers actually show
On August 11, 2026, the follow-up signal read like a shrug: investors monitored pre-market futures, traders reviewed briefings. Routine monitoring continues through Q4 2026; no escalation detected. The impacted domains—trade psychology, risk governance, information delivery—are precisely the soft metrics that justify spending on shiny dashboards while real P&L remains unchanged.
The parallel to algorithmic trading's early days is instructive. Early adopters of automated execution systems genuinely reduced slippage and captured alpha. This is not that. This is a notification service dressed in risk-management clothing.
The inconvenient metrics
No price impact has been observed. No volume shifts correlate with AMB release times. AutoModerator's own June 28 data shows its primary measurable impact was a 65% drop in misinformation—valuable for forum hygiene, irrelevant for P&L. What has changed is the bulletin-board chatter: investors feel more informed, which may reduce panic-selling. The June 28 briefing explicitly frames this as stabilizing participant risk perception through predictive churn modeling and adaptive tone calibration. That psychological buffer carries value—but it is not risk management.
Reality check: A synchronized broker-feedback trigger that tightens stop buffers does not prevent a stop-out; it just accelerates it. Faster information without better strategy amplifies execution speed at the expense of deliberation.
Real volatility, real nothing
On May 25, 2026, US markets dropped 9.3% from all-time highs, triggered by regulatory uncertainty and geopolitical tensions. On June 3, a second identical 9.3% drop and 3-day selloff unfolded. Tech and finance sold off hard. Trading volume surged. The VIX spiked and then stabilized around 16.8, creating a V-shaped recovery pattern. Not one AMB—which didn't exist yet—would have helped, but the market's behavior that week establishes a baseline: when real stress hit, nobody needed a briefing to know they were in trouble.
By late May, rising interest rates had forced portfolio rebalancing and amplified volatility across sectors. On June 5, the earnings calendar and regulatory changes triggered heightened cybersecurity risk across tech and financial sectors. On June 6, traders refined an IB60 algorithmic strategy analyzing 60-minute candlestick pullbacks, executing dynamic stop-losses, and the June 7 briefing noted a shift toward AI-driven trading tools. The VIX oscillated. Institutional desks adjusted. None of these moves required a centralized briefing engine—they responded to cash flows, funding stress, and order-book depth.
Goldman Sachs reported record Q2 profit on July 15: 92% earnings growth to $20.98/share, 72% equity revenue rise to $7.4B, M&A deals exceeding $1 trillion. On July 20, Goldman published three investment themes—physical consumer experiences, high-performing financial compounders, acquisition-targeted tech deals—as counterweights to AI infrastructure volatility. None of these decisions referenced a retail-facing weekly briefing.
Outlook through Q4 2026
The forecast horizon shows continued routine monitoring, zero escalation, and no structural shift. AutoModerator's July 3 projection: continued steady expansion with seasonal dips anticipated eight-month cycle. TradingHub's July 14 projection: participants retain use while expecting richer automation capabilities. AMB will maintain its weekly cadence, investor forums will discuss its recommendations, and the market will continue doing what it does regardless of who pushes the publish button.
When the next real volatility spike hits—the kind that crashes circuit breakers and triggers 5-sigma moves—AMB's value will be measurable by one metric: did it help anyone get out before the collapse, or did it just tell them about it three seconds faster?
The evidence from August suggests the latter. Automated market briefings are the financial equivalent of a newspaper that arrives at your door 10 minutes earlier but still reports yesterday's news. Useful. Comforting. Structurally irrelevant.
What rational investors should actually watch
- Order-flow composition: Who is buying, who is selling, and at what size—none of which AMB's community Q&A captures reliably. AutoModerator's June 28 framework reduces navigation to under ten clicks but tells you nothing about institutional block trades.
- Funding-market stress: SOFR spikes, repo fails, dealer balance-sheet constraints.
- Volatility term structure: Whether VIX futures are in contango or backwardation tells you more about hedging demand than any newsletter.
- Institutional order-flow models: In May–June 2026, these models absorbed two 9.3% drawdowns and an interest-rate regime shift without needing a weekly newsletter to decide. By August 2, retail traders themselves were shifting from simple moving averages to exponential MAs and stochastic oscillators—adapting faster than any centralized briefing could prescribe.
The rest is noise. Slightly faster noise, but noise nonetheless.
📉📈 The Rally Nobody Trusts
S&P 500 hits an all-time high — and the VIX goes up too. 📉📈 That's 4 million call contracts traded on a day fear rose a full point. Price up, fear up: a combo that rarely coexists outside of tops. The rally nobody trusts is still a rally — for now. Breadth is an illusion, vol spreads are screaming, and your index fund's return is basically just NVDA. Who's rotating out before the exit gets crowded?
The S&P 500 notched another all-time high on August 11, powered by a semiconductor bounce that dragged the index back from a two-week slide. On August 5, over four million S&P 500 call contracts traded—record liquidity—while the VIX rose a full point during a 1.8% rally. That combination, price up and fear up, rarely coexists. By the numbers, this looks like a recovery. It isn't.
The Vol Spread That Keeps Growing
The gap between realized S&P volatility and the Nasdaq equivalent widened to levels not seen since 2023. CBOE data confirms the August 11 reversal created the highest short-term call bias in NYSE options since early 2024. Meanwhile, the Cboe VIXEQ hit a record high as single-stock swings diverged from index-level calm. That divergence signals something uncomfortable—money rotated into large caps not out of enthusiasm but because alternatives offered no safe harbor. When traders crowd the same exit, the exit becomes the risk.
- May 29, 2026: Analyst notes rising sector volatility amid shifting trader focus toward individual equities; SMH shows extreme implied volatility spikes exceeding industry averages.
- June 26, 2026: MU shares close +15.74% post-earnings, but OTM call IV collapsed from 180% to 60–70%—gamma decay, not conviction.
- August 5, 2026: Market rallies 1.8% yet VIX rises +1 point, confirming asymmetric bet flow amplifies fear gauges even during upside moves.
What the Hedging Tells Us
The spike in call premiums on NDX futures doesn't reflect optimism. It reflects asymmetry: traders are willing to overpay for upside exposure because they expect volatility to snap back in either direction. That behavior correlates with previous market tops where positioning became expensive before a correction.
- Derivatives signal: Extreme call skew → priced-in insurance against a gap move, not directional conviction. On August 5, four million S&P 500 calls were sold simultaneously with a VIX spike—traders bought upside while paying for tail protection.
- Concentration distortion: The S&P 500's $67.185 trillion market cap as of June 30—an $8.74 trillion net gain since April—was driven almost entirely by NVIDIA's outsized rise. By August 10, iShares Russell 1000 Growth (IWF) showed zero YTD return (-0.8%), even as Vanguard's deep-value fund rose 22% via mid/small caps. The index's breadth is an illusion.
- Leadership fragility: By end of Q2, mega-cap dominance compressed YTD gains into a handful of names. On July 7, Microsoft, Alphabet, and Meta reported strong revenue but record capex and sharply reduced free cash flow—simultaneous sell pressure ended a two-month rally.
The Reversal Mechanism
A two-week dip erased by a single sector's earnings rally is not the mark of a healthy advance. By early August, corporate CapEx surges for AI had driven free cash flow yields 2.51% below Treasury yields—the widest gap since 1987. On July 7, Microsoft, Alphabet, and Meta each reported strong revenue growth offset by record capital expenditure. Meta dropped two spots in the top-10 ranking due to costly AI outcomes. If semiconductor earnings lose momentum—or if macro data forces a repricing of Fed rate expectations—the crowded large-cap trade will unwind through liquidity that isn't there. Figma's Q2 financials, reported August 7, show EV/FCF multiples near ~50x with GAAP losses of -$117.3M—a cautionary template for premium-priced tech.
Bottom Line
The S&P 500 sits at a record high while the market's internal wiring sends warning signals. Wide vol spreads, concentrated leadership, negative FCF yield spreads, and an options market pricing in tail risk rather than trend conviction do not compose a bullish foundation. As of August 9, 46% of S&P 500 stocks beat the index—up from 28% in 2024. That broadening could be a healthy shift, or it could be the market rotating out of megacaps before anyone calls it a peak.



Comments ()