78% Retail Trade Spike: Bot-Driven Technical Analysis Masks Fraying SPY Fundamentals
TL;DR
- 78% Surge in Bot-Driven SPY Trading: Retail Reliance on Technical Analysis Risks Cascading Liquidations. Is the 78% increase in automated technical analysis a hedge against volatility or a recipe for a flash crash?
- 13.1% Gold Crash: US Treasury Yields Shatter Safe-Haven Narrative in Global Markets. Is gold still a viable safe haven when US Treasury yields exceed 5%?
- 6% GDP Loss: UK-EU Trade Collapse Fuels Permanent Inflationary Loop. Is the UK's permanent 6% GDP contraction and rising inflation an inevitable cost of Brexit?
📉 The Algorithm’s Guide to Guessing
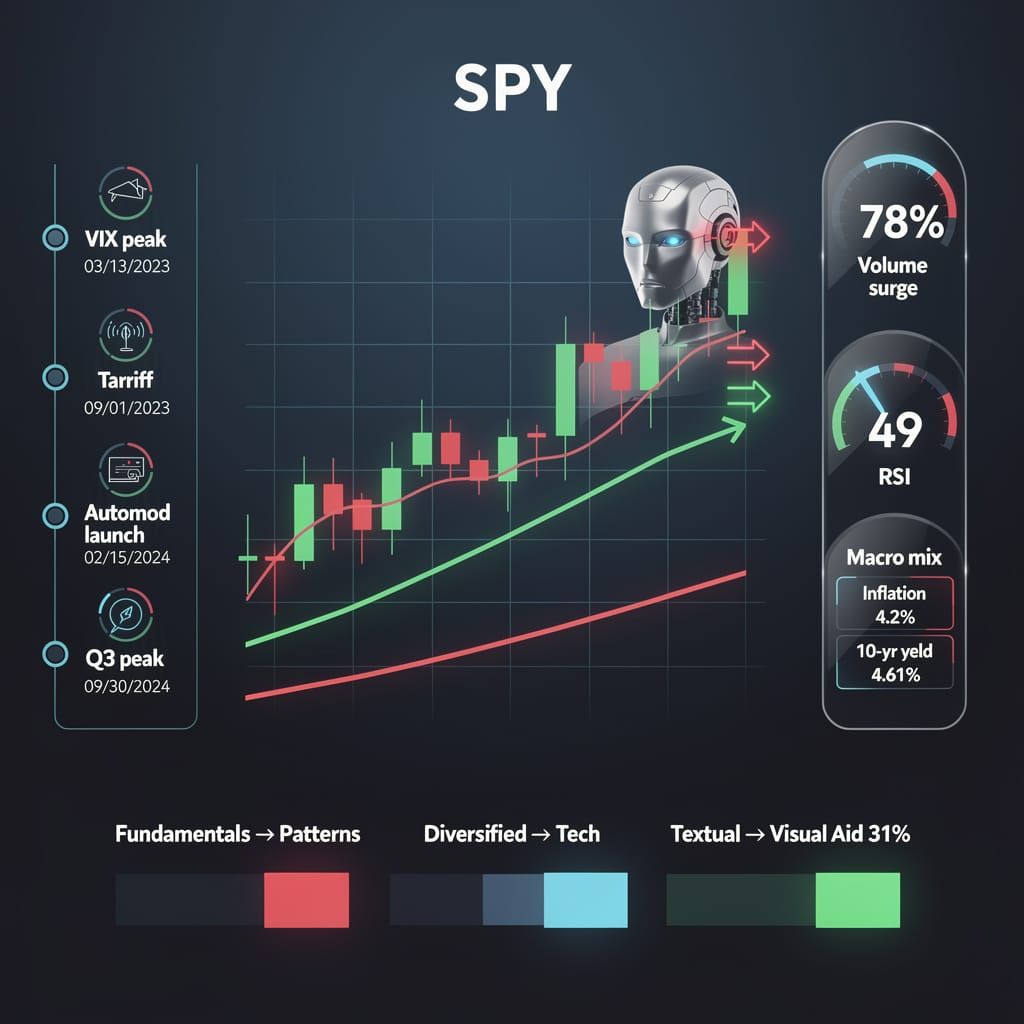
78% surge in retail trade volume based on bots drawing lines. Absurd 📉. That's nearly 4 in 5 traders outsourcing brains to patterns while fundamentals fray. AI bots adjust stop-losses in 5 seconds, ignoring sticky 4.2% inflation. Retail investors — are you trading a market or a painting?
On June 30, 2026, automated moderation systems began aggressively promoting technical analysis (TA) frameworks for the SPY ETF. This shift signals a retreat from fundamental valuation toward "tactical discipline"—a polite term for drawing lines on a chart and hoping the price respects them. This migration suggests that retail investors, exhausted by a market that dropped 9.3% from all-time highs in early June, are now outsourcing their decision-making to pattern recognition bots.
Does Pattern Recognition Equal Profit?
The surge in automated TA content correlates with a 78% increase in monthly SPY retail trade volume utilizing technical indicators. While proponents claim this provides "structure," the data indicates a hollow victory. Bank of America warns of a major S&P 500 correction from July to September, citing a weakening rally with the RSI dropping to 49 and a TD Sequential "red 13" signal indicating trend fatigue.
While bots hunt for "resistance breaks," the fundamentals are fraying. Consumer sentiment has plummeted to 53.3, and the 10-year Treasury yield sits at 4.61%, creating a gravitational pull that "visual patterns" cannot ignore. The current ecosystem relies on AI bots that adjust stop-loss thresholds within $\pm 5$ seconds of a break, prioritizing momentum over the fact that inflation remains sticky at 4.2% and the S&P 500 is struggling to hold the 7,334 level following a four-wave Elliott correction.
Market Shifts
- Trading Logic: Fundamentals → Visual Patterns (RSI/TD Sequential).
- Capital Use: Diversified Allocation → Concentrated Tech exposure (Nvidia/Broadcom).
- Education: Textual Analysis → 31% increase in quantitative visual aid enrollment.
The Automation Timeline
- March 27, 2026: VIX peaks as early volatility signals emerge.
- April 9, 2026: Tariff announcements trigger a critical pivot in market performance.
- June 30, 2026: Automod prioritizes TA threads to counter retail signal fragmentation.
- Q3 2026: Projected peak in TA adoption; bot-driven stop-loss clusters likely to trigger cascading liquidations.
Systemic Effects
- Liquidity: High retail volume → increased surface liquidity but higher fragility during flash events.
- Psychology: Reduced investor autonomy → total reliance on automated "resistance milestones."
- Volatility: $\pm 5$-second bot adjustments → amplified micro-swings in SPY pricing.
By substituting economic reasoning with automated chart-reading, the market replaces genuine analysis with a digital echo chamber. This reliance demonstrates a critical gap in investor literacy: the belief that a bot's ability to spot a "head-and-shoulders" pattern constitutes a legitimate hedge against 150 Brent crude and a semiconductor downturn.
📉 The Gilded Illusion: Gold’s Safe-Haven Identity Crisis
13.1% monthly crash! Gold's "safe haven" status is a joke, losing value faster than a luxury car. 📉 While the world burns, 5.2% Treasury yields make gold an unbearable luxury. Retail traders are bleeding while central banks hoard for survival. Is your portfolio actually protected?
Gold is currently undergoing a crisis of identity. While textbook theory suggests geopolitical chaos in the Strait of Hormuz should propel the metal, June 2026 demonstrates a decoupling of tradition from performance. On June 24, gold broke below the $4,000 threshold—its lowest level since November 2025—resulting in a 13.1% month-over-month decline.
Why is the "Safe Haven" Failing?
The failure of gold to act as a hedge indicates that macroeconomic pressures now outweigh regional instability. US inflation, surging amid wartime energy spikes, enables the Federal Reserve to maintain a trajectory of rate hikes. This correlation results in a migration of capital away from non-yielding assets toward Treasury yields that hit 5.2% in May 2026.
Investors are reacting to a causal chain: wartime energy spikes → persistent inflation (CPI 3.8%–4.2%) → aggressive rate hikes → stronger USD → gold devaluation. The "fear trade" is a fantasy; when the 30-year Treasury yield surpasses 5.19%, the opportunity cost of holding gold becomes an unbearable luxury for retail traders.
Performance Gaps
- Gold: 13.1% monthly drop → confirms loss of hedge utility for speculators.
- US Treasuries: 30-year yield $\approx$ 5.2% → triggers global bond sell-offs and equity valuation compression.
- US Dollar: DXY near 99.32 → erodes commodity valuation.
- Central Banks: 1,000-tonne annual average acquisition → provides a structural floor, despite retail panic.
The Forecast of Falling Floors
There is a glaring contradiction in the data: while retail traders flee, central banks are hoarding. The ECB reports gold has overtaken US Treasuries as a reserve asset, with US Treasury shares dropping to 22% of global reserves. This institutional pivot is not about "investment" but survival—37% of emerging economy central banks cite fear of financial sanctions as the primary driver.
However, institutional hoarding cannot stop a retail bleed when the Fed’s "higher-for-longer" stance persists. Speculative sentiment remains delusional, trailing price action that has already pivoted to yield.
- July 2026 (Early): Consolidation between $3,900 and $4,300, contingent on oil recovery.
- July 2026 (Mid-Late): Potential slide toward $3,800 if CPI reports confirm persistent upward pricing pressure.
This trend demonstrates a systemic shift: geopolitical risk no longer guarantees a rally when the US dollar offers both safety and a 5%+ yield. The "store of value" argument staggers when gold is outperformed by the very government debt it is supposed to hedge.
📉 The Brexit Tax: A Permanent Inflationary Engine
6% permanent GDP contraction: a staggering self-inflicted wound 📉. That is like erasing the entire economic output of a mid-sized city overnight. The BoE admits Brexit is a structural inflation engine while youth unemployment doubles to 16.2%. Timid rates or systemic collapse? UK citizens — are you feeling the 'Brexit Dividend' yet?
Bank of England officials now admit that Brexit complicates inflation control, framing the geopolitical divorce as a structural catalyst for sustained price rises. This admission confirms a causal chain where labor scarcity and trade fragmentation erode macroeconomic stability, leaving the UK to navigate a self-inflicted inflationary loop while the rest of the world moves on.
Why Is Inflation Persistent?
Brexit-linked barriers to cross-border mobility restricted the influx of EU workers, creating acute labor supply stress. While some point to non-EU migration, the reality is a collapse in workforce growth: net migration plummeted from 944,000 in March 2023 to just 204,000 by June 2025. This dysfunction is compounded by a staggering failure in youth employment, with youth unemployment rates doubling since 2016 to 16.2%, leaving over 1 million youth NEET. This combination of skill depletion and systemic unemployment enables remaining workers to demand higher wages, resulting in input costs that producers pass directly to consumers.
Structural Failures:
- Competitiveness: Ranked 24th among 29 nations in the 2026 World Competitiveness Ranking → systematic decline in global standing.
- Trade: 12% overall decline in UK-EU trade (services down 39%, chemicals down 21%) → 6% permanent GDP contraction.
- Investment: FDI rank dropped to 69th globally → severe capital outflow and delayed innovation.
The Monetary Mismatch
The Bank of England’s decision to maintain interest rates at 3.75% on June 18, 2026, demonstrates a timid approach to structural deficits. Monetary tightening targets demand, yet it ignores the supply-side collapse. While the MPC avoids hikes to protect a softening labor market—where vacancies hit a 5-year low of 707,000—this restraint ignores the fact that regulatory compliance costs for micro-businesses have spiked by an average of 40%.
Economic Projections:
- Q4 2026: Inflation peaks as geopolitical energy shocks from the Iran conflict collide with domestic wage-price spirals.
- 2027: Price levels projected to remain above 3% as the Bank signals potential rate cuts despite ongoing structural instability.
- Mid-Decade: Long-term stagnation continues unless the UK accepts the "costly reintegration" of the EU single market.
Operational Impacts:
- Currency: Sterling instability → higher import costs → compounded consumer inflation.
- Exports: Goods exports down 12% since 2021 → reduced product diversity (down 53.8% in some sectors).
- Fiscal: 8% rise in national living costs → increased pressure on social welfare and healthcare funding.
Comments ()