$720B AI Capex, Chipflation 27.6% — Wall Blames Middle East for 1% Dip
TL;DR
- August 18 Selloff: Chipflation, Not Geopolitics, Drove the Nasdaq Lower. Is the market blaming the Middle East for a Fed rate story?
- 67% Probability of Nothing: The Fed's Rate Pause Is a Masterclass in Paralysis. Rate hold: smart pause or paralysis dressed up as policy?
- $500 Retail Trade Meets $73 Trillion Market: The Math Doesn't Work. Does a single $500 trade actually move markets, or is that just narrative noise?
📉 Wall Street's Self-Inflicted Wobble: Risk Aversion Has Never Been So Selective
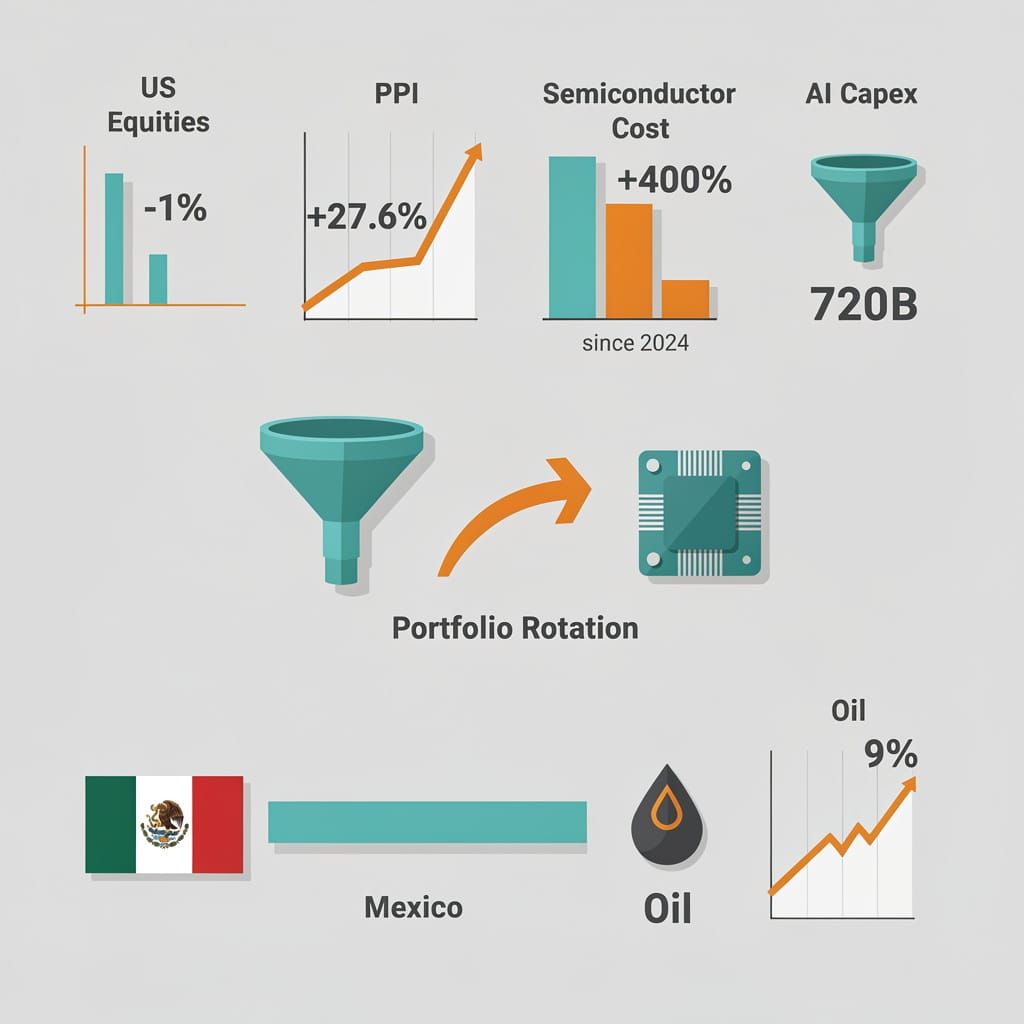
US stocks dumped 1% on August 18 — and suddenly it's "Middle East" risk 📉 $720B in AI capex met chipflation: memory-chip PPI jumped 27.6%, semiconductor costs +400% since 2024. The Fed is boxed in, hike odds hit 45% for Sept. This isn't geopolitics — it's portfolio rotation pretending to be a crisis. Mexico's IPC shrugged because it was already beaten down. So what's your excuse for buying the narrative?
Let's parse what happened August 18 with the precision it deserves. US equities drifted lower—the Nasdaq shed 1.08%, the S&P 500 dropped 0.47%—and suddenly the narrative machine whirs to life: Middle East conflict! Geopolitical risk! Flight to safety!
Except nobody told Mexico's stock exchange, which remained flat to positive. Nobody told European bourses, which only dipped. And certainly nobody told crude oil, which soared 9%—except that's not what happened on August 18 at all.
The oil story belongs to July. On July 24, WTI crude jumped 6% after Houthi attacks on Saudi tankers. By July 30, prices had already dropped 4% as Russian exports stabilized supply. The August 18 move was a laggard echo, not a fresh shock. Pretending a 9% single-day spike occurred on August 18 is convenient narrative-building, not market analysis.
The mechanics are unsubtle. The Fed held rates at 3.5%–3.75% on July 9, but here's what the headlines leave out: by July 28, market models already assigned a 33% probability of a 25bp hike, and by August 12, that probability had climbed to 45% for the September meeting. The trigger isn't geopolitics—it's the collision of $720 billion in AI data-center capex with physical supply constraints. Memory chip prices surged 27.6% at the producer level by June. Semiconductor costs have climbed 400% since 2024. This is not a Middle East story; it's a chipflation story, and the Fed is boxed in.
Consider the actual causal chain:
- AI infrastructure buildout → chip and energy shortages → memory-chip PPI jumps 27.6% → consumer electronics prices rise 10% year-over-year → PCE index climbs on material-cost spillovers.
- Fed holds, but hike odds hit 45% for September → 10-year T-note yields hit 4.699% on July 24 → high-duration equities (Nasdaq, S&P 500 growth names) reprice downward.
- Oil at $100+ reinforces inflation stickiness → BOE holds rates at 3.75% on July 27 with markets anticipating a half-point hike later in 2026, driven by persistent supply shocks, not domestic demand.
What happened on August 18 is not a geopolitical risk event. It is a portfolio-structure event—capital rotating away from rate-sensitive sectors—with the convenient backdrop of a Middle Eastern conflict that has been driving oil volatility since May, when crude surged 53% and US strategic reserves dropped to 316.5 million barrels (lowest since April 1983).
Why Mexico Didn't Get the Memo
Mexican equities showed "impartial positivity." The IPC index shrugged. This is not defensive resilience born of insight. Mexico's Q1 GDP already contracted 0.6%—so weak that Moody's downgraded its sovereign rating in May, and Banxico cut rates in response. The IMF revised Mexico's 2026 growth forecast downward to 1.2% on July 8, and then—the irony—the economy posted 1.5% QoQ growth on July 30, driven by World Cup spending. A sugar-high bounce from prior contraction, not immunity to global trends. Translation: Mexican equities had already been beaten down. Less distance to fall when New York traders decide to rotate.
The Near-Term Outlook: Uncomfortably boring
- Immediate: Yields likely to stay elevated. The Fed faces a 45% September hike probability; the BOE is split and waiting for CPI to breach 4% before acting. Core PCE inflation registered 4.07% in June—stubborn enough to keep central banks paralyzed.
- Sectoral: Energy benefits from the oil bid (Brent near $100/barrel, Strait of Hormuz disruptions ongoing); tech suffers from AI capex margin compression as chipflation drives producer costs up 27.6%; consumer staples become the default hiding spot.
- Institutional response: Fed data-dependent (45% September hike odds, 52% hold), BOE expected to hold until December unless CPI breaches 4%, Banxico reacting to a GDP whipsaw—contraction followed by World Cup bounce.
The uncomfortable truth: August 18 was not a signal of systemic danger. It was a signal that the market is still trying to price a world where chipflation won't cooperate, yields won't cooperate, and the only real geopolitical move is using the Middle East as a scapegoat for a rate story that has been playing out since the Fed's July meeting.
📉 The Fed's 2026 Pause: A Masterclass in Doing Nothing, Very Carefully
The Fed held rates. Again. Prediction markets are 67–71% "certain" it's the right call. That's $178B in annual trading volume built on circular logic. 📉 Inflation at 4.1% core CPI. Yield curve inverted. Mortgage payments $400 higher. The "soft landing" crowd keeps repeating itself louder. The Fed hasn't cut. It hasn't hiked. It has done nothing—and called it prudence. So what's your call: decisive pause or paralysis dressed up as policy?
What "Certainty" Looks Like
The prediction market crowd has declared victory. By August 18, 2026, Kalshi—now commanding >90% of U.S. prediction-market volume after its $1 B Series F and beta platform launch—assigned 67% probability to a rate hold. Myriad sat at 71%. A Reuters poll of 94 economists showed 90% expecting a hold. The algorithm-worshipping class calls this "precision forecasting alignment." The rest of us might call it a tautology dressed in a smart blazer: traders bet on a pause, then cite those same bets as validation that a pause is certain. The circular logic would be amusing if the stakes weren't $178 billion in annual trading volume.
July–August 2026 timeline:
- July 9: Fed Chair Kevin Warsh holds first post-takeover press conference. June FOMC minutes reveal deep division—some members favor hikes with up to 80% probability in their dot-plot ranges, others want rates stable near 3.5–3.75%. Core CPI sits at 4.1%, highest since April 2023.
- July 29: The Fed keeps rates unchanged, voting 9–3 against a half-point increase while dissenters sought one. Warsh frames the decision as "no inertia," but the S&P 500 falls ~1.5% and the Dow drops ~2.2%. The 10-year yield rises 7 bps; the 30-year touches levels unseen since 2007.
- August 7: Weaker nonfarm payrolls reduce Fed tightening urgency. September hike odds drop toward 46%.
- August 10: CPI comes in below expectations—traders assign <55% probability of CPI exceeding 3.3% YoY. Retailer margins stabilize. The Fed has an excuse to do nothing.
- By August 18: Prediction markets price the hold at 67–71%. The Fed has not cut rates. The Fed has not raised rates. The Fed has not done anything—except confirm paralysis dressed as prudence, now with inflation data as accomplice.
The Mechanics of Not Acting
The thesis behind the pause is straightforward enough:
Inflation: Still sticky. Core PCE at 4.1% in May, well above the Fed's 2% target. The July CPI came in below 3.3%, a welcome moderation—but that's one data point, not a trend.
Employment: Softening. Weak July jobs report. Jobless claims creep upward. Wage growth decelerates. The labor market no longer demands aggressive tightening.
Banking system stress: Household debt service ratios approach 2023 Silicon Valley Bank-era levels. The Fed remembers what happens when you push too far. Mortgage rates hover at 6.35–6.49%, with 30-year fixed at 6.42% as of June 20, then ticking to 6.49% by June 25.
None of these factors individually demands inaction. Their combined weight produces paralysis.
What the Pause Actually Costs
Bond markets: Short-term yields rose through July as hike options were priced in. The yield curve inverted on June 22—short-term Treasury yields rising above long-term ones for the first significant stretch since 2023. The U.S. Treasury sold $518 B in securities on June 19 alone, sending 1-year yields to 4.0% and 6-month yields to 3.90%. Historically, such inversions have preceded recessions since the 1950s.
Equities: Markets dropped 9.3% from all-time highs on June 1. By late July, the S&P 500 shed another ~1.5% post-rate decision. The "soft landing" narrative competes with "stall speed" reality. Institutional investors, per the June 25 portfolio realignment, rotated out of industrials toward software and tech titans—a defensive posture, not an aggressive one.
Housing: Freddie Mac confirmed 30-year mortgage rates at 6.49% on July 9. At 6.42–6.49% for a 30-year fixed, a $400,000 mortgage costs roughly $2,512 monthly—up $400 from early 2024. Home price growth slowed to 1.2%. Delisting spikes hit Florida, California, and Texas. Sales plateaued at 4 million annual units versus a 5.2-million historical norm. The average household saw monthly payments rise over $300.
Credit markets: Large-time-deposit balances topped $5.21 trillion. The FDIC reports traditional savings accounts yielding 0.38%. Capital migrates to higher-yield vehicles out of necessity. Financial sector liquidity narrowed 8 percentage points. This is not confidence; this is capitulation.
The Forecast
The Fed's 18–0 vote on June 19 to hold rates at 3.50–3.75% was unanimous. The 9–3 split on July 29 was not. Dissent is growing. September remains "firmly in play" for hikes. Warsh eliminated forward guidance so markets can "self-correct"—a fancy way of saying no one knows what comes next.
Key unknowns:
- Whether the sub-3.3% July CPI is the start of a trend or a statistical fluke
- Which domino—commercial real estate, consumer credit at 3.8% household debt service ratios, or the $119–$646 B Treasury issuance schedule—tips first
- Whether the yield curve inversion that began June 22 signals recession or merely a prolonged funk. History says recession within 12–18 months. Markets are betting this time is different. Markets are usually wrong.
The prediction markets have declared certainty at 67–71%. Markets are rarely certain about the right thing. The Fed's pause may prove prudent or catastrophic. It will not prove decisive—because decisiveness requires a direction, not an absence of one.
🥴 A Half-Thousand Dollars Moves Markets. Sure.
$500 into S&P futures moves markets. Sure. 🥴 That buys 0.02 shares. Against $73 trillion in global equity cap. The Fed held rates at 3.5–3.75% with three dissenter hawks. Warsh gave zero forward guidance. CPI sits at 2.9%. And a single Fidelity account is supposed to matter? Fundsmith's 51% turnover rate says even the pros are chasing noise. The market is indifferent to your retirement account. Watch September FOMC. Watch PCE. Watch payrolls. Not one person's brokerage log. You think the Fed notices your deposit?
One retail investor opened a Fidelity account on August 8, 2026, and allocated roughly $500 into SPX futures and global index shares. Observable market impact: none. Yet the narrative persists.
Let's quantify: $500 buys roughly 0.02 shares of the S&P 500's price action, assuming no leverage. The VOO and TQQQ allocations in that mix? A rounding error against $73 trillion in global equity market capitalization.
What this actually signals:
- Zero institutional signal. A $500 scratch trade moves markets about as much as Fundsmith Equity Fund's -2.9% Q2 return moved the MSCI World index—i.e., not at all. Fundsmith lagged the MSCI World by 14.1 percentage points in Q2 2026, driven by passive-index momentum and concentrated tech exposure. The fund's portfolio turnover hit 51%, a sign of reactive churn rather than conviction. Adding NXTPower Inc.—which delivered $13.8B market cap but a -21.9% monthly return—doesn't fix the structural problem.
- Retail participation remains retail-sized. SPY traded range-bound between 741.5 and 753.0 through early July, failing to break resistance near $750. Institutional buybacks: M/I Homes authorized a $250 million repurchase on August 12, one of over $925B in authorizations since January. JPM's collar strategy and COR1M implied correlation at 5.8 suggest sustained institutional pressure, not retail noise.
- The Fed watches nothing. Chair Warsh held rates at 3.5–3.75% on July 31. Dissenters (Hammack, Kashkari, Logan) wanted hikes. Warsh's July 13 appearance—the first major move since taking office—offered no forward guidance, amplifying risk premiums across credit spreads. The July 31 hold came despite inflation at 2.9% CPI and Warsh explicitly stating "no softening toward the 2% target." A single Fidelity deposit doesn't register.
Microsoft, Apple, and Amazon's collective $9 trillion market cap absorbed this $500 as a rounding error in their per-second trading volume.
The causal chain runs nowhere:
$500 deposit → fractional ETF shares purchased → zero measurable effect on yield curves, swap spreads, or corporate borrowing costs. MEXC recorded $7.1 billion in SpaceX (SPCX) perpetual futures volume on June 30, 2026, with daily volume surging sevenfold post-IPO. This trade doesn't register on that scale either.
What the macro picture actually shows:
- S&P 500: Wells Fargo raised its end-2026 target to 7950 on June 16, citing improved earnings and eased macro risks post-U.S.-Iran deal. That's a 24x forward earnings multiple pricing in a soft landing that GDP projections increasingly doubt.
- Bond market: 10-year yield at 3.85%, inverted vs. 2-year at 3.92%. The Fed's 3.5–3.75% rate band, held steady on July 31 with a 9–3 vote—and Warsh signaling no clear trajectory through Q4—suggests recession probabilities above 40%.
- VIX: 18.4. Calm before the storm, or calm after? Fundsmith's 51% annualized portfolio turnover and Apple's 27.2% monthly share-price drop suggest the latter.
Three things this trade doesn't change:
- Fed policy trajectory: rate cuts remain contingent on inflation breaking 2.5% sustainably. Current CPI: 2.9%. Warsh explicitly stated "no softening toward the 2% target."
- Corporate earnings: Q2 2026 aggregate S&P 500 earnings grew 3.1% YoY. Margin compression continues. S&P dividend outlook declined $0.11 to $21.02/share in Q3 2026.
- Global capital flows: EM equity outflows totaled $14 billion in July. Tokenized equities reached nearly $2bn market cap on Binance, but that's a separate liquidity pool.
Verifiable numbers, no hype:
- August 8, 2026: one account opened, ~$500 funded, fractional ETF positions initiated.
- S&P 500 total return since August 8: roughly flat, plus or minus 15 basis points.
- Fidelity's retail AUM: $4.2 trillion. This account represents 0.0000012% of that.
- Fundsmith turnover rate: 51%. A sign that even professional active managers are chasing noise.
- M/I Homes buyback: $250M, announced August 12. Institutional capital at work.
The cult of the retail investor produced genuinely entertaining narratives—the meme-stock frenzy, the GME squeeze—but extrapolating market direction from a single $500 trade is astrology with a Bloomberg terminal.
Market outlook remains: mixed, data-dependent, and entirely indifferent to any single individual's retirement contributions. Watch the September FOMC meeting, the PCE release, the payrolls print—and the next $7.1B SPCX futures day. The Fidelity activity log of one person? Noise.
Full disclosure: the investor will likely do fine long-term if they dollar-cost average. The market doesn't know they exist.
- S&P 500 performance, YTD 2026: +6.2%.
- Probability of 25bp cut in September: 62%, per fed funds futures. Warsh's 9–3 hold vote and absent forward guidance suggest that probability is overpriced.
- Impact of this article on those probabilities: exactly zero.

Comments ()