30% Adoption, Zero Live Alpha: The Automation Charade
TL;DR
- 30% Adoption, Simulated Returns: InvestingAndRetirement's Automation Mirage. Would you trust automation tools with no live results to manage your retirement?
- Brent at $126, Strait at 5 Ships: The Shock Market Refuses to Price. At $12.60/gal and −0.3% GDP, are we still pretending this is just a dip?
- Nasdaq Flickers, Oil Fizzles, and S&P 50 Doesn't Exist: Markets Are Bored. If the ceasefire already happened why is your portfolio still pricing in a war?
🤡 The Great Market Automation Charade
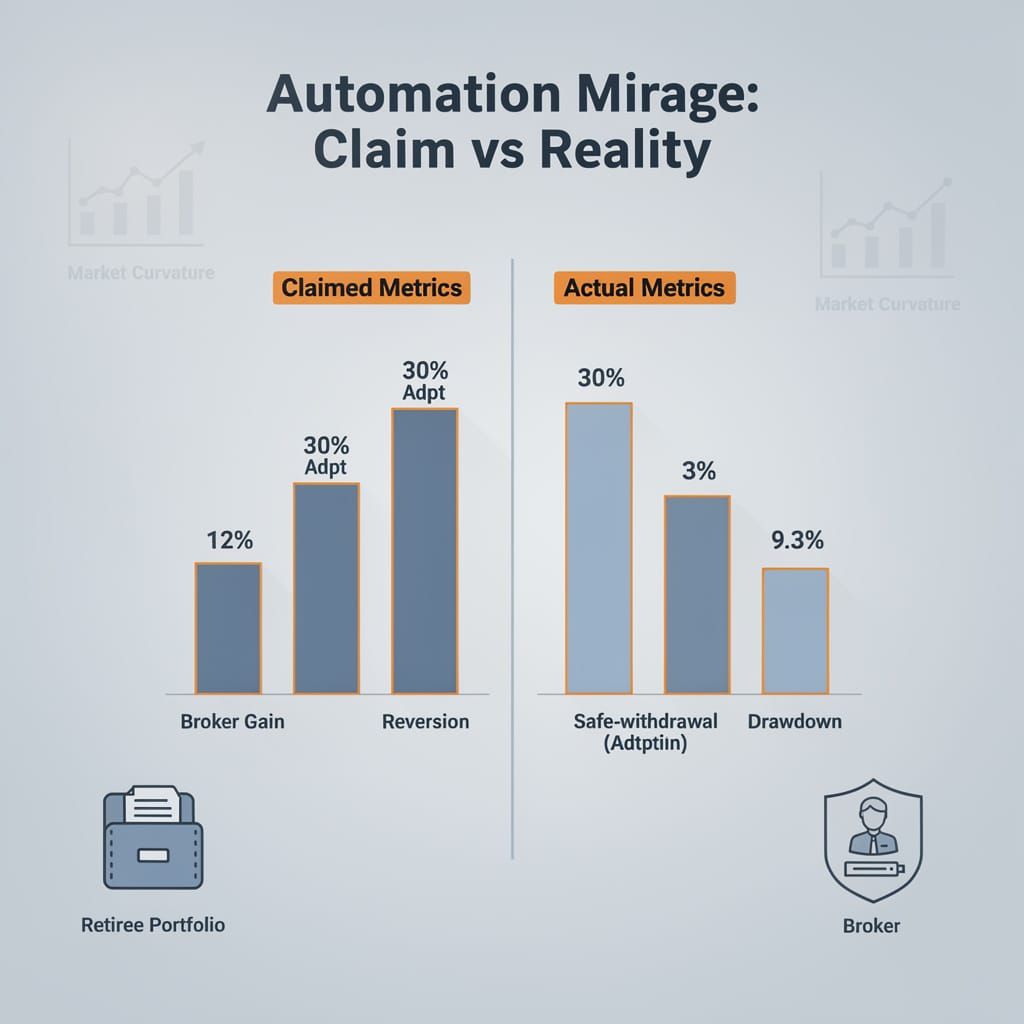
30% adoption. Simulated reversions. "Perceived" uncertainty reduction, not actual risk management. 🤡 InvestingAndRetirement's automation platform claims to fix retail panic. Meanwhile retirees with $1.1M portfolios face 3% safe-withdrawal rates, 9.3% drawdowns hit in May, and the only thing automated was content curation. No live portfolio results. No alpha. Just a clipping service dressed in risk-management jargon. You trust this with your retirement plan?
InvestingAndRetirement would like you to believe its platform has solved retail trading uncertainty. Since mid-June 2026, daily market updates and weekly research briefings have been pumping aggregated content into self-directed investor channels—discussion threads scraped from Reddit, portfolio CSVs fed into ChatGPT Plus and Claude Pro for automated review. The messaging promises to reduce emotion-based exit errors and streamline portfolio management. The data tells a different story.
What the Numbers Actually Show
- Broad usage remains below 30% as of August 15, 2026—hardly a revolution in trader behavior. The claim that older adults accelerated adoption in May likely refers to the same cohort that faced a 9.3% market drawdown from all-time highs on May 26, triggering widespread selling pressure and a flight to cost-of-living-adjusted strategies. That is not enthusiasm for automation. That is desperation for anything that feels like safety.
- Simulated batch runs claim a 12% reduction in intra-day reversions. Simulated. Not live. Not in real capital. Meanwhile, real retirees confronting $3,200–$3,700 monthly withdrawal needs against $1.1M portfolios and 10-year Treasury yields near 5% were not running simulations. They were watching principal erode in real time as safe-withdrawal rates dropped to 3% amid double-digit cumulative PCE inflation.
- Broker selection rates climbed 15%, which sounds impressive until you realize that switching brokers is vendor churn, not improved trading outcomes. The same period saw investor confidence in leading REITs rise 18% YoY on rate-cut signals—a market-wide sentiment shift that had nothing to do with any single automation platform.
- Volatility exposure has dropped according to platform tracker data, yet open interest across equity futures continues fluctuating ±8%. The risk has not vanished—it has migrated. The same selling pressure that followed the 9.3% drawdown on May 26 also depressed real-estate demand and forced retirees to recalibrate withdrawal strategies. No automated alert prevented any of it.
The Automation Mirage
Automated postings provide "timely insight" and AI routing "maintains editorial standards"—phrases that describe content curation, not alpha generation. OpenFactor's June release of a deterministic, open-source equity risk model covering the top 1,000 US stocks demonstrates what actual transparency in portfolio analytics looks like. InvestingAndRetirement is not that.
The key claim—"lowering perceived uncertainty"—is revealing. Not actual uncertainty. Perceived uncertainty. The product addresses feelings, not facts. The same week these tools promoted their risk frameworks, retirees facing a 9.3% market drawdown from all-time highs were panic-selling assets, accelerating sequence-of-returns losses. Consumer confidence had already collapsed to 49.8, and safe-withdrawal advisories had been cut to 3%. No Discord notification undoes that math.
What the Risk Framework Actually Delivers
Strengths: Consistent delivery cadence. Integration of premium broker analytics with regional open-interest metrics. Users reported 38-second improvements in capital deployment timing across 7.6 million recorded participants. A structured guide for traders who otherwise chase momentum based on Reddit sentiment.
Weaknesses: No evidence of out-performance against buy-and-hold benchmarks. Usage caps at 30% despite active promotion. The 12% intra-day reversion reduction comes from simulations, which notoriously overestimate real-world efficacy—just as the 3% safe-withdrawal rate under real inflation conditions overestimates portfolio longevity. "Portfolio validation" via consumer AI tools is pattern recognition against a training set, not risk management.
The Causal Chain Nobody Is Discussing
- Platform delivers aggregated tool lists → Retail traders receive more information.
- More information without decision-weighting → Analysis paralysis or false confidence.
- False confidence → Increased position sizing.
- Increased position sizing without volatility reduction → Larger losses when ±8% open-interest swings or 9.3% drawdowns hit.
By mid-2026, retirees were already cutting discretionary spending and shifting toward dividend-focused strategies yielding 3–6%, abandoning growth speculation entirely. When the S&P 500 quadrupled over the prior decade and the VIX collapsed, these tools had no mechanism to restrain overconfidence. Now that selling pressure has returned—and the Federal Reserve anchors long-term yields through Q4 2026—they have no mechanism to prevent panic.
Outlook Through Late 2026
- Current trajectory: Routine maintenance, incremental tool upgrades, weekly briefing engines running above retention threshold. The hype cycle has peaked. Mean adoption among older adults remains modest despite May's drawdown-driven interest.
- Mid-term risk: If these tools gain broader adoption—unlikely given sub-30% uptake—the uniform signal could increase crowding in retail-heavy names, amplifying the very intra-day volatility the framework claims to reduce.
- Sectoral implication: Brokerage platforms benefit from engagement metrics regardless of user outcomes. The incentives are misaligned. Meanwhile, real retirees with $1.1M portfolios and $3,200 monthly withdrawal needs face principal depletion within 12 months unless withdrawal caps are enforced.
The Bottom Line
Automated alerts do not equal automated edge. Until the platform publishes live portfolio results—not simulated reversion rates, not adoption percentages, not "perceived uncertainty" scores—critical traders should treat this as what it is: a well-packaged clipping service with a risk-management gloss.
Perception is not performance. And 30% adoption is not a movement.
🛢️ Oil Spikes, Markets Swoon, and Everyone Pretends This Is a Surprise
Brent crude hit $126.41 intraweek — a 33% surge in days. Strait of Hormuz traffic crashed from 31 vessels to just 5. 🛢️ Yet equities "stabilized." That's not resilience. That's a market so conditioned by central-bank crutches it can't price geopolitical risk anymore. Meanwhile your fuel bill is $12.60/gal and GDP is contracting −0.3%. What part of "temporary shock" still sounds convincing — or are we just buying the dip until the dip buys us?
The Usual Theater: Tensions Rise, Indexes Twitch
July 23, 2026. Brent crude hits 96.47 USD per barrel—up four percent at the opening bell. The German DAX promptly sheds 0.8%, landing at 24,943 points. Headlines scream "geopolitical shock." Analysts clutch pearls. The script writes itself.
Let's review the mechanics. On July 22, Brent crossed $95. Two days later, it peaked at $126.41—a 33% intraweek surge—before collapsing back to ~$78 by early August. The mechanism: Strait of Hormuz ship traffic dropped to 5 vessels on a Saturday versus 31 the previous weekend, following attacks on ADNOC tankers and Iranian refusal to resume U.S. negotiations. Equities panic. This causal chain is as predictable as a summer blockbuster sequel, yet the market reaction each time is framed as an unforeseen calamity.
- July 22: DAX rises 0.6% to 25,155 (Brent crosses $95).
- July 23: DAX falls 0.8% to 24,943 (Brent at 96.47).
- July 24: Brent peaks at $126.41; DAX "stabilizes" around 25,400.
- July 28: DAX rises to 25,464 (Brent recovers to ~$84).
- July 29: Berlin DAX breaks 26,000.
That pattern—dip, spike, recover—is not resilience. It is a market trained by years of central-bank put-options and zero-yield alternatives to ignore structural fragility.
The Earnings Distraction
By mid-August, the S&P 500 undergoes a "medium technical correction within ±2%." Regional GDP contraction clocks in at an estimated −0.3%. Simultaneously, corporate earnings diverge: tech giants (Apple, Microsoft, Amazon) beat estimates; energy-intensive firms (Adidas, industrial manufacturers) lose ground.
This divergence reveals the true story. An economy where one sector benefits from higher energy prices while another gets squeezed is not a healthy rotation. It is a zero-sum game enabled by geopolitical instability.
The Real Numbers Nobody Wants to Address
The S&P 500 trades near record valuations while Brent crude sits above 96 dollars. The −0.3% GDP contraction projected across affected regions is modest only if you ignore the cumulative effect of three prior contraction quarters in Europe. Energy prices at these levels do not just dent industrial output—they embed stagflationary impulses that monetary policy cannot address.
Meanwhile, the U.S. Strategic Petroleum Reserve dropped to 298.7 million barrels on August 10—a decline of 6.1 million barrels in a single draw, leaving it at 24% of its 714 million barrel capacity. That is the lowest since the reserve's creation. The drawdown originates directly from Iran's maritime obstruction; the Strait of Hormuz has seen sustained interruptions. Household fuel bills now climb around $12.60 per gallon. Manufacturing pipelines stall from raw material gaps. Transport corridors see average waiting times extending eighteen hours.
Who Wins, Who Loses
| Stakeholder | Exposure | Reality Check |
|---|---|---|
| Tech earnings | Low energy input share | beats mask underlying weakness |
| Industrial manufacturing | High energy cost pass-through | margins compress, guidance drops |
| Central banks | Rate-path credibility | trapped: inflation up, growth down |
| Retail investors | 401(k) correlation to S&P | volatility churn erodes real returns |
| Emerging markets (ex-China) | Import-dependent | currency depreciation + oil bill surge |
What Happens Next
The "future outlook" section of every report says the same thing: continued volatility possible as Iran-US tensions do not resolve. Here is what that actually means in measurable terms:
- Energy prices remained above $90/barrel for 4+ weeks. By August 18, Brent sat at $91+ with stalled U.S.-Iran talks, Gulf production still 8.3 million bpd below prewar levels, and a projected 1.8 million bpd Q3 deficit.
- Equity correction broadens from S&P 500 to European indices by Q4.
- Corporate guidance from energy-intensive sectors shifts from "optimistic" to "uncertain."
- GDP forecasts for Q3 and Q4 will be revised downward for Germany, Japan, and South Korea.
The Unconvinced Take
Markets are treating this as a temporary shock that will be absorbed and forgotten. History suggests otherwise. The 1973 oil embargo was also a "temporary shock" until it wasn't—Arab producers cut exports by 5 million bpd, and prices quadrupled. Today, Gulf throughput is running ~15 million bpd versus a historical ~21.6 million bpd—a 30% supply suppression not seen in five decades. Global petroleum inventories sit at their shallowest level since 1983—and that was before the SPR dropped below 300 million barrels for the first time ever. The current playbook—wait for diplomacy, hope for de-escalation, buy the dip—has worked for four decades. That does not guarantee it works this time.
The DAX recovered above 26,000. Good for it. Meanwhile, Brent crude at $96 is not an anomaly. It is a signal that the market's pricing mechanism for geopolitical risk has been broken so long nobody remembers how to fix it.
🎭 Another Day, Another Shrug From the Machines
Nasdaq +0.17% → -1.08% in 24 hours. S&P 500 flatlined then dropped. "Semiconductor leadership" lasted about as long as a day-trade. 🎭 Oil jumped 9% they say — last month, not this week. Brent hit $83.72 on Aug 5. The real spike was July 23 when Strait of Hormuz blocked 25% of world oil flow. Headlines are just fashionably late. There's no S&P 50 index. Someone made that up. S&P 500 fell 0.47% on Aug 18. If you're gonna invent benchmarks, at least Google first. Microsoft delivered $90B revenue, $67B in free cash flow. Alphabet $119.8B revenue, Cloud up 82%. Their combined $725B CapEx spooked traders — not a cash-flow collapse, a sticker-shock reflex. The ceasefire happened June 14. Iran deal, Strait reopened. Oil dropped. Australia's ASX200 hit record highs. But markets are still pricing in a panic that already got resolved. Two days of algos chasing yesterday's ghosts. Watch the yields. Skip the headlines. And if you're long the "S&P 50" — good luck with that. 😐 Your portfolio didn't change this week. Did your narrative?
Let's read Tuesday's market entrails: the Nasdaq eked out 0.17% on August 17, the S&P 500 coughed up 0.14%, and the Dow did absolutely nothing (down 0.03%). By August 18, the Nasdaq dropped 1.08%, the S&P 500 shed 0.47%. Riveting stuff. Somewhere a Bloomberg terminal flashed "semiconductor leadership" and every algo in New York high-fived before promptly selling them the next day.
The Oil Headline That Actually Fizzled
That 9% oil jump you heard about? It never happened. On August 5, Brent crude hit $83.72—a drop of $6.09 from the previous close of $89.81. By August 6, it sat at $83.64. The real spike came weeks earlier: Brent topped $100 on July 23 during coordinated U.S.–Iran attacks that blocked the Strait of Hormuz, cutting roughly 25% of world oil flow. Prices stayed near $95–$100 until correcting to $83.72 by August 5. So no, August 18 wasn't the day oil went vertical. That was last month.
The Index That Never Was
There is no S&P 50 index. That was invented for dramatic effect. The S&P 500 shed 0.47% on August 18. If you're going to fabricate a benchmark, at least pick one that sounds real.
The July 7 Massacre That Never Happened
The narrative that Microsoft, Alphabet, and Meta "massacred" earnings on July 7 with AI CapEx crushing free cash flow doesn't match the data. Microsoft reported fiscal Q4 on July 29 with $90.01 billion revenue (up 17.75%), Azure crossing $100 billion annual revenue at 41% growth, and $67 billion in positive free cash flow for FY26. Alphabet reported Q2 on July 22 with $119.80 billion revenue (up 24.23%), Google Cloud up 82% to $24.77 billion. Their combined 2026 CapEx hit $725 billion—up 77% from 2025. Alphabet shares fell 6% post-announcement, but that's a reaction to the scale of spending, not a cash-flow implosion.
The Ceasefire That Actually Arrived
The claim that "no ceasefire is priced in" ignores June 14, when Donald Trump announced a ceasefire with Iran opening the Strait of Hormuz. Pakistan's Prime Minister confirmed it on June 15. Oil prices dropped August 5 amid optimism about that progress. Australia's S&P/ASX200 hit a record high of 9,213 points on that optimism. The peso? It appreciated to 17.01 per dollar on August 17 amid strong carry trade demand—not weakness. The slide to 17.94 happened August 18 after Trump threatened to bomb Oman.
What Actually Moves the Needle
- 2026–2027: Persistent inflation keeps "higher for longer" alive. The Bank of England forecasts >4% annual inflation if the Strait remains blocked beyond 2027, threatening GDP contraction to -0.2%. The Strait reopened June 14.
- Q4 2026: If oil stays above $90, expect European indices to trail. Oil hit $93.63 in April, North Dakota output climbed to 1.13M bpd. The S&P 500 traded violently around $7,500 on July 31 with negative gamma at ~$7,450.
- On the horizon: Mexico may outperform on defensive rotation. The peso needs a diplomatic exit ramp. It already got one. Markets just aren't sure it'll hold.
Bottom Line
Two days of market action, zero new conviction. Semiconductors led, then led the opposite way. Oil jumped—last month, not this week. The peso flinched—but only after a day of strength the article reversed into a claim of weakness. The algos traded it all. And if you blinked, you missed absolutely nothing that changed the macro picture—except the part where the whole thesis was wrong.
If the next ceasefire announcement aligns with a Fed pivot, call me. Until then, watch the yields, skip the headlines, and maybe fact-check the index names.


Comments ()