2.7-Point Credit Rise: US Household Debt Hits $18.79T Amid Sentiment Collapse
TL;DR
- +2.7 Point Credit Bump: US Consumers Face $18.79T Debt Wall Amid Fed Rate Warnings. Is a marginal increase in credit scores a sign of financial recovery or a symptom of consumer desperation?
- Naira Stability: 5% Appreciation in Nigeria Driven by Reserve Depletion and Hot Money. Is the Naira's recent 5% climb a genuine recovery or just a temporary illusion fueled by CBN reserve spending?
- 9.3% US Equity Drop: AI Capex Spikes Trigger Systemic Risk in S&P 500. Is the AI-driven market rally a sustainable growth trend or a mathematical illusion fueled by unsustainable capital expenditure?
📉 The Credit Score Mirage
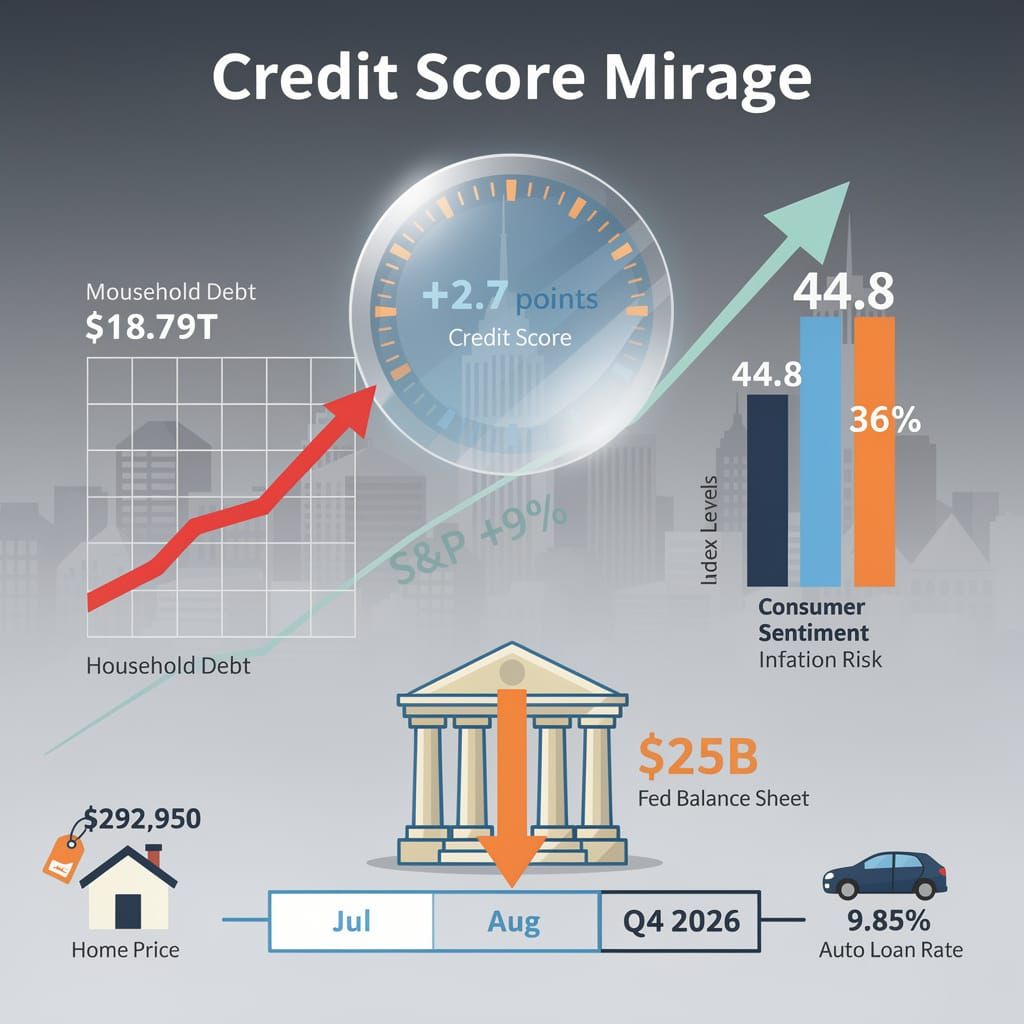
2.7 points. This pathetic flicker in credit scores is essentially a rounding error 📉. While the Fed calls a $25B balance drop "discipline," it smells like desperation. $18.79T in household debt vs. a sentiment low of 44.8. Is this stability or just a slower crash? US Consumers — are you actually feeling wealthier, or just scared to spend?
WalletHub reports a marginal uptick in credit scores, averaging a +2.7 point increase compared to Q1 2025, with Indianapolis leading at +3.03. This statistical flicker is framed as a systemic triumph, yet it ignores a volatile backdrop. While the data credits lower utilization and fewer defaults, the causal chain is fragile. These gains coincide with a May 12 Federal Reserve report noting a $25 billion decline in credit card balances in Q1 2026—a "discipline" that is likely a symptom of desperation. This is corroborated by June 26 data showing 36% of consumers name inflation as the primary risk to their welfare, far outweighing unemployment at 7%.
Is Stability Actually Sustainable?
The narrative claims disciplined payment behavior creates "stable employment pathways," but the correlation is tenuous. Credit scores are lagging indicators reflecting past survival, not future prosperity. Any perceived momentum is countered by a brutal macroeconomic reality: the S&P 500 surged 9% year-to-date as of May 23, yet this equity rally diverged sharply from a historic low Consumer Sentiment Index of 44.8. Meanwhile, the Federal Reserve is signaling rate-hike momentum under Chair Kevin Warsh to combat inflation pressures and energy spikes driven by Iran-related supply disruptions.
- July 2026: Scores superficially climb as holiday spending is suppressed by frugality and lending cycles reset.
- August 2026: Temporary stabilization as consumers recalibrate budgets post-holiday.
- Q4 2026: Projected plateau or decline as the gap between wage growth and costs—exemplified by Portland starter homes hitting $292,950—widens.
Homeownership: Minor score gains → stagnant mortgage rates (~6.75%) → negligible impact on the affordability crisis. Labor Market: Improved ratings → perceived "stability" → continued reliance on debt-funded consumption amid 9.85% new auto loan rates. Financial Inclusion: Higher indexes → expanded access → increased exposure to systemic shocks with household debt hitting $18.79 trillion as of June 24.
Regulators highlight "improving financial inclusion," but the reality is an expansion of credit to a population blinded by information asymmetry. A FICO survey reveals 59% of Americans are unsure about the home-buying process, proving that a few points on a credit report do not bridge the gap to actual ownership. The projected momentum lasts only until the next energy shock or rate hike, at which point this "disciplined behavior" will revert to the mean of economic distress.
📉 The Naira's Brief Moment of Stability
5% climb! A desperate liquidity injection masking a 25.6% fair-value deficit 📉. The CBN is spending reserves to buy a temporary illusion of stability. Portfolio 'hot money' fuels 95% of inflows while the real economy flees to cash. A fragile shield or a ticking bomb? Nigerians, do you trust this rate?
The Central Bank of Nigeria (CBN) is claiming victory after targeted dollar sales pushed the naira to N1,368.27 per dollar on July 7, 2026. This 5% climb from the N1,390 range is being marketed as a triumph of monetary discipline, though it functions more as a desperate liquidity injection than a structural recovery.
Is This Real Stability?
The CBN’s intervention, supported by external reserves that climbed above $50 billion by mid-June, supposedly suppressed volatility. However, this "shield" is a simple spend-to-prop mechanism. While officials celebrate, the IMF suggests the naira remains fundamentally undersold, trading roughly 25.6% below its fair value. This artificial ceiling is further undermined by a systemic retreat; foreign exchange turnover dropped 18% to $70.43 million across 82 transactions in early July, indicating that institutional demand didn't vanish—it simply waited for the CBN to exhaust its reserves.
Currency Mechanics
- The Trigger: Targeted dollar sales → immediate increase in official market supply.
- The Result: Naira appreciates 5% → official rate hits N1,368.27/$1.
- The Correlation: Reserve injections → narrowed gap between official and parallel rates, though the latter lingers near N1,400.
The Forecast
The current trajectory suggests a fragile equilibrium maintained by the sovereign fund rather than systemic health. The reliance on "hot money" is blatant; portfolio investments accounted for 95% of the $10.37 billion in foreign capital inflows in Q1 2026. These yield-chasers provide an illusion of confidence while the real economy fractures, evidenced by cash usage outside the formal banking system hitting N5.193 trillion by June 23—a 2.16% increase from April.
- Short-term (July 2026): Subdued movements as policy reassurance maintains a temporary ceiling on volatility.
- Mid-term (Q3-Q4 2026): Gradual convergence of rates, provided the CBN continues depleting reserves to offset domestic outflows.
- Long-term (2027): Absolute dependence on oil price stability to sustain balance-of-payments resilience, as structural weaknesses persist.
Market Dynamics
- Official Market: N1,368.27 rate → enables lower nominal import costs for short-term cycles.
- Parallel Market: Stability at N1,400 → demonstrates lingering distrust in the official rate's sustainability.
- Liquidity: 18% turnover drop → indicates a freeze in institutional trading activity.
📉 The Mirage of Stability
9.3% drop in May was just the start. The 'AI growth' fairy tale is collapsing under record capex costs—a financial black hole 📉. Stability is a mathematical illusion. Is your portfolio actually growing, or just hedging against the inevitable? US Investors — are you seeing real returns or just expensive promises?
Market communications from June to July 2026 demonstrate a recurring pattern: the substitution of concrete data with "forward-looking language." While indices maintain a facade of resilience, the underlying signals indicate a systemic reliance on hedging against ambiguity. The recent end of a two-month S&P 500 rally on July 7—triggered by record capital expenditures and reduced free cash flow at Microsoft, Alphabet, and Meta—demonstrates that the "AI-driven" growth narrative is buckling under its own cost.
Is Volatility the New Baseline?
Corporate disclosures suggest that "uncertainty" has become a permanent hedge. The inability to forecast basic commodity inputs is evident in the fragmented energy landscape. While some firms project "strategic expansions," others are merely reacting to chaos. This volatility creates a causal chain where unpredictable input costs force operational adjustments, which then trigger regulatory scrutiny, ultimately limiting capital expenditure.
Industrial & Commodity Friction
- Input Costs: Volatile diesel prices in the Philippines—including significant rollbacks to P12.94/liter in April followed by fluctuating adjustments in May—resulted in unstable profit margins for logistics units.
- Material Risk: Oil price swings, specifically the $4 drop to $69/barrel in early July, create unstable revenue streams for extractors despite temporary diplomatic thaws.
- Regulation: Stricter environmental compliance and community engagement requirements in the Canadian greenstone belt now mandate structural planning modifications.
Sectoral Vulnerabilities
- Technology: High-beta firms face heavy selling as leverage increases and AI earnings fail to justify massive capex spikes.
- Logistics: Supply-chain disruptions in hardware and aviation persist, driven by macroeconomic volatility and the 9.3% US equity drop in May.
- Mining: Increased regulatory scrutiny and supply-chain bottlenecks elevate hedging costs, offsetting the gains from rising gold and silver prices.
The Projection Gap
The prevailing sentiment is one of cautious retreat. Bank of America’s June 5 warning for investors to take profits—supported by seven bear-market indicators—indicated that the rally lacked a fundamental foundation. The reliance on a few mega-cap tech firms created a fragile peak, which collapsed when the market realized that revenue growth is being swallowed by infrastructure costs.
- Q3 2026: Projected increase in hedging positions as participants anticipate a correction, with the S&P 500 likely remaining range-bound absent improved profitability.
- Year-End 2026: Forecasted persistence of economic pressure across healthcare compliance and energy logistics.
This cycle of "monitoring" and "adjusting" demonstrates a market in stasis. Until firms move from disclosing risk factors to delivering tangible free cash flow, the current stability remains a mathematical illusion driven by defensive positioning.



Comments ()