$2.6 Trillion Options Surge: S&P 500 Volatility Risks as AI Capex Anxiety Hits US Markets

TL;DR
- $2.6 Trillion Options Surge: S&P 500 Driven by Algorithmic Volatility and Institutional Buybacks. Is retail option trading a legitimate strategy or just a high-speed lottery funded by algorithmic manipulation?
- 9.3% Market Slide: AI Speculation Masks Systemic Liquidity Void in US Equities. Is the current AI investment surge a genuine economic driver or just a mask for a systemic liquidity crisis?
- 5 Billion Insider Accumulation: US Markets Tethered to Legal Loopholes and Section 301 Risks. Is the current market rally organic growth or just a scripted performance fueled by insider anticipation and legal loopholes?
🎰 The Option Illusion: Retail Speculation vs. Market Reality
$2.6 trillion in options volume—a staggering amount that turns the S&P 500 into a casino 🎰. While retail traders chase lottery tickets, HFT algorithms and $925B in institutional buybacks actually steer the ship. High-speed gambles or actual investing? Retail traders — are you trading a strategy or just guessing?
Market participants spent July 2, 2026, treating strike prices like lottery tickets. This fascination persists as retail traders navigate a landscape where algorithmic dominance and a $925 billion institutional buyback wave dictate actual price action, regardless of how many out-of-the-money calls are bought on a whim.
Is Strategy Just Guesswork?
The surge in retail option volume demonstrates a decoupling of trading from fundamental value. This is a causal chain where high-frequency trading (HFT) algorithms trigger gamma squeezes—exemplified by the S&P 500 exceeding 6,500 on April 1 as options volume hit $2.6 trillion. Retailers buy the hype, market makers hedge by buying the underlying stock, and the resulting artificial rally collapses upon expiry.
Market Dynamics:
- Algorithmic Risk: High-speed execution → retail slippage → rapid capital erosion.
- Regulatory Pressure: 0DTE oversight → looming limits on leverage.
- Volatility Loops: June 25 gamma flip zones → self-reinforcing trends → retail liquidation.
The Performance Gap
Retailers chased semiconductor gains—with SanDisk reporting a 462% year-to-date rise and 251% YoY revenue growth—only to be blindsided by the June 1 correction that wiped 9.3% off all-time highs. The
📉 The AI Mirage and the Capital Void
9.3% crash from highs—staggering loss equivalent to erasing trillions in paper wealth 📉. A desperate capex surge masks a fundamental GDP void. Is the AGI pivot just a rebranded liquidity crisis? Retail investors — is your portfolio actually growing or just rearranging its vulnerabilities?
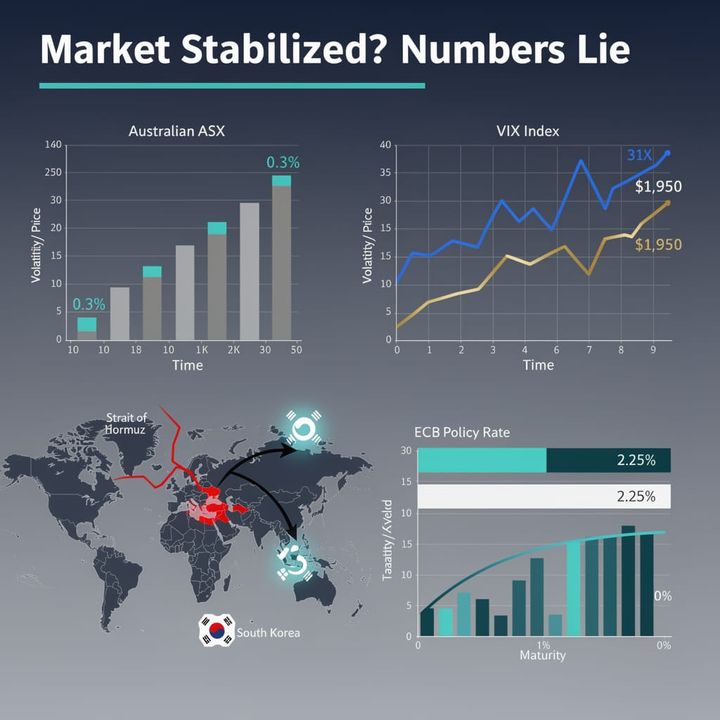
Market analysts are currently attempting to weave a cohesive narrative out of fragmented failures and speculative pivots. The prevailing thesis suggests that AI investments are stabilizing equity markets, yet the data indicates a volatile shell game. The S&P 500’s 7.7% rise for 2026 is not a sign of health, but a byproduct of a desperate capex surge, exemplified by SK Hynix’s $129 billion investment to double memory-wafer capacity—a move that simply institutionalizes a projected supply shortage through 2030.
A Pattern of Mismanagement?
The sequence of events from late 2025 through mid-2026 demonstrates a disconnect between institutional stability and speculative mania. The October 2025 capital crisis revealed a fragility that regulatory bodies failed to preempt. By June 2026, the pivot to AGI funding didn't solve the liquidity crisis; it rebranded it.
This fragility was exposed on June 2, when US markets dropped 9.3% from all-time highs as geopolitical tensions and Federal Reserve rate signals collided. The "confidence" cited by bulls is selectively curated: while analysts raise price targets for KLAC and Marvell, the broader reality involves NVIDIA dropping 12% following China export restrictions and Microsoft slashing R&D by 18% to preserve cash.
- October 2025: Capital crisis triggers market halts; liquidity evaporates.
- November 2025: Indian equities restart amidst regulatory delays.
- May 2026: Brent crude peaks at $114/barrel; 30-year Treasury yields hit 5.198%, pricing in persistent inflation.
- June 2026: S&P 500 slides as Alphabet and Amazon succumb to "capex anxiety"; CoreWeave insiders exit $2.3 billion in stakes.
The Cost of Diversion
This shift enables a dangerous decoupling of valuation from reality. The causal chain is transparent: regulatory delays and geopolitical shocks lead to capital flight, which seeks refuge in the highest-growth narrative available. This results in a market that isn't growing, but merely rearranging its vulnerabilities.
Institutional Risk: Deferred approvals → eroded trust → increased emerging market volatility. Sectoral Shift: Diversified Equities → AI Speculation → reduced portfolio stability. Geopolitical Link: Oil volatility ($70–$114) → inflationary pressure (4.2%) → stress on AI capital.
While some point to a $100 million stock-repurchase by Caris Life Sciences as a sign of recovery, these are rounding errors compared to the systemic risk of a 1999-style bubble. The market is not evolving; it is hiding behind high-bandwidth memory margins to mask a void in fundamental GDP growth.
📉 The Choreography of the Trade
5 billion tech holdings accumulated before policy reveals—an absurd level of "anticipation" 📉. Like a scripted play for retail suckers. While the S&P 500 wobbles, the admin pivots from illegal tariffs to new loopholes. Who is actually paying for this "growth" in your city?
Market participants are currently celebrating a "growth trajectory" that looks less like organic expansion and more like a scripted performance. The rally observed around July 2, 2026, wasn't a triumph of fundamentals, but a reaction to the administrative juggling of trade barriers. Investors are treating the temporary expiration of Section 122 tariffs as a victory, conveniently ignoring that this "cushion" is merely a transition to a more aggressive regime.
Coincidence or Calculation?
While retail investors cheer short-term returns, the mechanics suggest a systemic disregard for transparency. The causal chain is clear: private accumulation precedes policy pivots. By April 8, 2025, strategic holdings in tech reached $12.8 million, later swelling to $5 billion in technology equities just before AI action plans were publicized. This pattern of "insider anticipation" anticipation enables a perception-driven return that bypasses standard audit pathways.
This fragility is now exposed by judicial constraints. The Supreme Court's ruling in Learning Resources, Inc. v. Trump—and subsequent Court of International Trade decisions—deemed IEEPA and certain Section 122 tariffs unlawful. The administration's clumsy pivot to Section 301, targeting 60 countries under the guise of forced labor compliance, demonstrates that market "stability" is currently tethered to the government's ability to find a legal loophole.
The Governance Gap
- Transparency: Record-high securities transfers without full disclosure → erosion of institutional credibility.
- Accountability: Legal pivots from IEEPA to Section 301 → replacement of stable trade law with administrative volatility.
- Market Integrity: Policy-driven momentum → fundamental analysis replaced by the timing of presidential announcements.
What Follows the Rally?
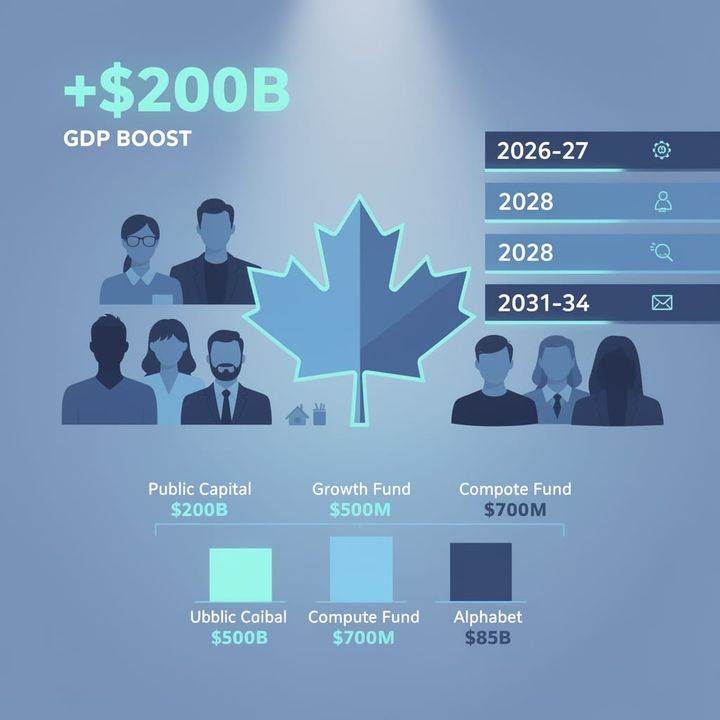
The current decoupling from economic indicators is stark. While Alphabet raises $84.75B for AI infrastructure and NVIDIA reports record profits, the broader index is fracturing. On June 29, the S&P 500 dropped 1.95% to 7,354.02 as Alphabet (-6%) and Amazon (-4%) sank under AI capex anxiety. This indicates a dangerous feedback loop: concentrated exposure to speculative AI narratives is compounding losses as mega-caps stumble.
Meanwhile, the macro context is stagflation. Energy-driven inflation pushed the May CPI to 4.2%. The Federal Reserve's decision to hold rates steady provides a temporary shield, but it ignores structural pressures from tariffs that surged from 2.3% to 10.9% in 2025.
- July 24, 2026: Section 122 tariffs expire; new Section 301 tariffs hit 60 countries (10%–12.5% rates), including the EU, Japan, and Mexico.
- Q3 2026: S&P 500 stabilization expected only if the Fed pivots; meanwhile, U.S. households face an estimated $1,500 annual cost increase.
- 2027: High volatility projected as the disconnect between AI-hyped valuations and the reality of 12.5% tariffs on critical ASEAN pipelines reaches a breaking point.
Investors continue to mistake a lack of oversight for a bullish trend. As long as returns remain positive, the ethics of execution remain an optional luxury.
Comments ()