$100 Oil Mirage: U.S. Lifted Hormuz Restrictions, Tankers Crossed—Yet Headlines Scream Crisis
TL;DR
- $100 Oil Mirage: OPEC+ Discipline, Not Scarcity, Drove the Brent Rally. Is $100 oil a genuine supply crisis or manufactured panic?
- $100 Oil Mirage: Brent Breaches Triple Digits But Delivers No Market Rescue. Who wins when $100 oil locks in rate hikes and kills equity premiums?
- 2.8% Inflation, $100 Oil, 2.25% Rate: ECB's September Hike Theater. Who gains when central banks hike into supply shocks?
🛢️ The $100 Oil Mirage
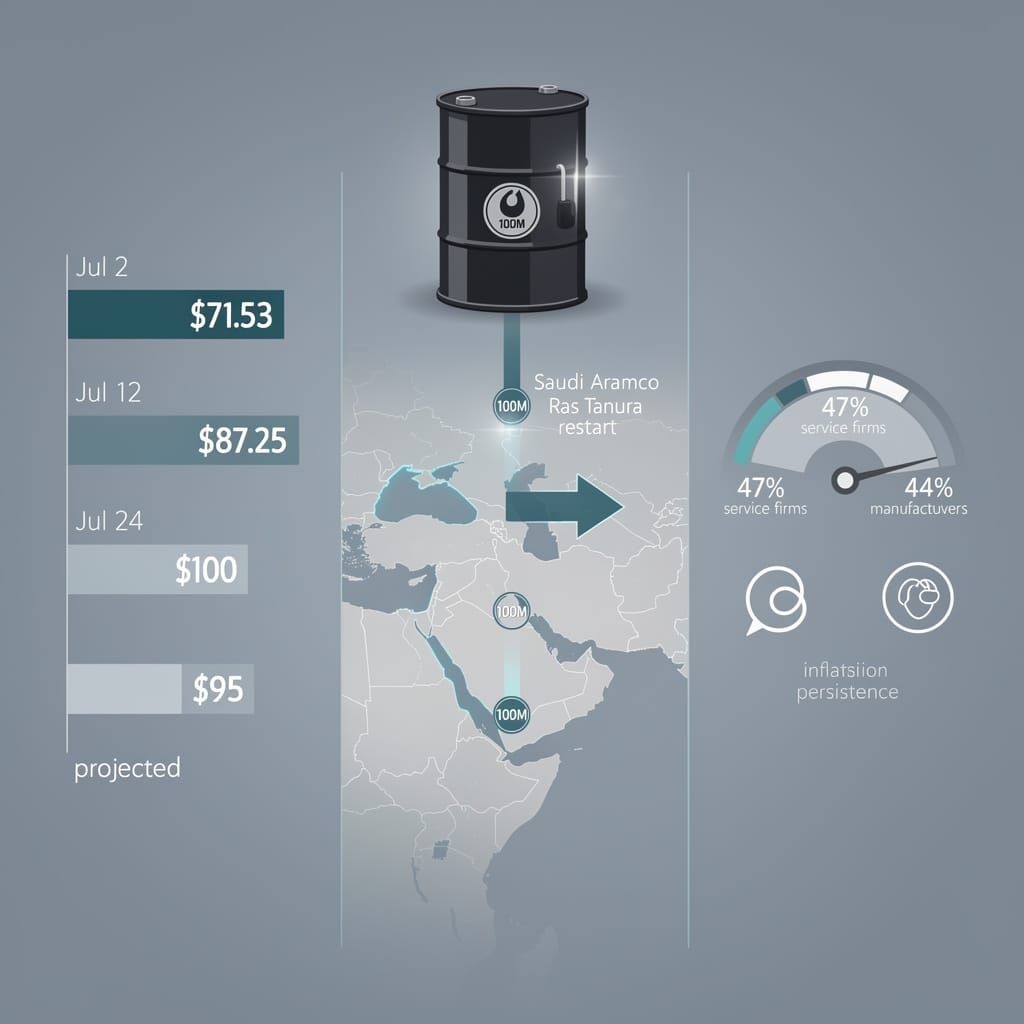
Brent crude hit $100 on July 24 but the "oil shock" narrative is pure fabrication 🛢️ U.S. lifted Strait of Hormuz restrictions in June, not tightened them. Tanker traffic accelerated. Brent was at $71.53 on July 2 before climbing on OPEC+ discipline, not tariffs or scarcity. 100 million barrels crossed Hormuz since the ceasefire. Saudi Aramco restarted Ras Tanura. The price reflects geopolitical premium and cartel production limits—not a broken market. Meanwhile, New York Fed data shows 47% of service firms and 44% of manufacturers plan price hikes within six months. Inflation persists regardless of oil. The tariff architecture generates exactly what it claims to prevent: higher costs, strained allies, and manufactured panic. Markets calling this a fundamental breakout are going to misallocate capital through October. The data supports contraction toward $95—if Hormuz stays open. What's your oil price floor for Q4 2026?
What Actually Happened
On July 24, Brent crude touched $100 per barrel—a round number the market loves to cheer. Headlines blared. Analysts clutched their lapels. Another oil shock, they said. Another test of global resilience.
Here is what actually drove it: nothing structural. The U.S. lifted Strait of Hormuz restrictions in June, not tightened them. By July 2, tanker traffic accelerated and Brent sat at $71.53—before climbing to $100 by July 24, driven by OPEC+ output restrictions and Middle East tensions. The causal chain the financial press insists on—tariffs → transit limits → $100—is backwards. The restrictions were removed. On June 12, Donald Trump cancelled plans to strike Iran and a Swiss-brokered memorandum authorized temporary Hormuz clearance. Brent fell 3.46% that same day to $87.25. The price rose anyway—because OPEC+ output discipline, not tariff policy, created the tightness.
The Mechanism Nobody Explains
Let us trace the actual chain. OPEC+ announced a 188k bpd July output increase on June 1, but with UAE having exited the group and Gulf states unable to fully execute cuts due to conflict damage, the "increase" barely offset prior losses. The IEA reported global demand contracted to a 97.9 mb/d low in May. Supply dropped to 94.5 mb/d. That 3.4 mb/d gap—demand already contracting—is the mechanical reality. The narrative that this represents an uncontrollable oil shock is manufactured.
Asian equity indices declined sharply on June 26—the KOSPI plunged 9%, triggering a circuit breaker. The driver? Apple raised prices across most product lines on June 25 after DRAM and NAND prices quadrupled from AI server demand, plus yen weakness hitting a 40-year low of 161.59. Imported fuel as 20% of retail spending is real strain, but the sell-off had a tech-and-currency trigger, not purely an oil one. Apple's own margin dropped to 38.7% by June 19 from supply costs alone.
Three Consecutive Days of Fantasy
- June 12: Brent falls to $87.25 after Trump cancels Iran strike and Hormuz clearance is authorized. OPEC cuts demand forecast to 970k bpd.
- July 2: Brent at $71.53. U.S. SPR at 325.7 million barrels—lowest since 1980s, below the Pentagon's 243-million-barrel operational minimum.
- July 24: Brent reaches $100. Headlines declare crisis.
The forecast—$95 within seven days as stabilization mechanisms activate—carries low confidence. On July 10, the IEA reported a 4.62 mb/d surplus emerged after Hormuz reopened and output surged 4.1 mb/d in June. Yet prices climbed anyway. The models are guessing because the inputs are political, not geological.
What This Actually Demonstrates
Oil at $100 does not signal scarcity. The U.S. lifted restrictions. One hundred million barrels crossed Hormuz since the ceasefire. Saudi Aramco restarted Ras Tanura. On July 5, OPEC+ raised output by 188k bpd via digital approval and Brent dropped to ~$72/bbl—near pre-strike levels. The price reflects OPEC+ discipline and geopolitical premium, not a broken market.
And here is the real punchline: Fed researchers at the New York Fed published findings on July 8 showing 47% of tariff-paying service firms and 44% of manufacturing units plan further price increases within six months—81% total. Contractual inflexibility and "trickle-up" pricing delays mean inflation persists regardless of what oil does. The tariff architecture generates exactly what it claims to prevent: higher costs, strained allies, and a $100 floor.
The Real Story
This is not an oil crisis. It is a policy loop—blame producers, declare shock, repeat, while ignoring that on June 20 the IEA downgraded global demand by 1.1 mb/d as Brent fell below $80. The actual mechanics remain functional. The IEA projects demand recovery to +2 mb/d only in 2027. Meanwhile, U.S. SPR reserves sit at 325.7 million barrels—below the Pentagon's security floor—and Cushing, Oklahoma storage nears minimums. The artificial price suppression from reserve releases expires this autumn.
Markets that treat $100 as a fundamental breakout rather than a geopolitical-OPEC+ artifact will misallocate capital through October. The data supports contraction toward $95—but only if Hormuz stays open. The incentives support persistent volatility. The headlines, as always, support the panic.
🛢️ The $100 Barrel Mirage: Why This Oil Spike Won't Save the Market
Brent crude just breached $100 per barrel — and Wall Street is pretending it's 2022 all over again. 💀 Here's what $100 oil actually buys: no rate cuts. Fed Chair Warsh signaled hikes. Core PCE at 3.1%. CPI at 3.8%. The equity risk premium on the S&P 500? Squeezed to 320 bps. The energy sector is 4.2% of the S&P 500. A 15% earnings jump there adds 0.6% to index EPS. Meanwhile airlines, logistics, and retailers eat the margins. Net impact on aggregate corporate earnings? Negative. U.S. shale added ~250k bpd. The SPR sits at 316.5M barrels — lowest since 1983. By Q4, Brent slides back to $88–92. No naval escorts. No expanded interdiction zones. Insurance premiums for Red Sea transits tripled since 2024. This isn't a disruption — it's a structural tax. S&P -0.8%. NASDAQ -1.2%. Small Caps -1.5%. Risk assets repricing for stickier inflation. $100 headline that delivers broad-market stagnation. Who exactly wins here besides the tanker insurers? 🛢️
Jul 27, 2026 — Brent crude breached $100 per barrel on Friday, and Wall Street is pretending it's 2022 all over again. Houthi raids along the Bab el-Mandeb corridor struck two Saudi oil tankers on July 23, damaging one vessel and reversing a recent price decline. The mechanical chain is straightforward: fewer hulls moving through the chokepoint, tighter crude supply, higher spot prices. But anyone treating this as a bullish signal for energy equities or a reflation trade is reading the wrong map.
Consider what $100 oil actually buys right now. The Federal Reserve's preferred inflation gauge—the core PCE—still hovers near 3.1%, well above the 2% target. A sustained energy-price spike adds roughly 0.4–0.6 percentage points to headline CPI over a rolling quarter—and with April CPI already at 3.8%, oil above $100 doesn't materialize rate cuts. It ensures rates stay pinned. Fed Chair Kevin Warsh signaled on July 13 the Fed is moving toward rate hikes, with seven FOMC members projecting at least one increase before year-end. Rate cuts? Delayed until at least early 2027. The equity risk premium on the S&P 500, already compressed to 320 basis points, gets squeezed further.
Then there's the demand side. Global manufacturing PMIs have softened for three consecutive months. China's import volumes dropped 2.1% in June. European industrial orders are flat. The micro-mechanism at work: when crude sustains triple digits, non-OPEC producers boost output—U.S. shale operators permitted marginal production increases of roughly 250,000 barrels per day in late July, with Diamondback Energy activating spare capacity—while the U.S. Strategic Petroleum Reserve has fallen to 316.5 million barrels, its lowest since April 1983, after politically motivated drawdowns. Price-sensitive buyers in emerging markets throttle consumption. The lagged effect, visible by Q4 2026, is a supply-demand rebalancing that pushes Brent back toward $85–90.
- Week of Jul 23: Houthi missile strikes on Saudi tankers → Brent crosses $100; VIX jumps to 22.4.
- Aug–Sep 2026: Shipping capacity reduced 8–10%; spot crude trades $102–$105.
- Q4 2026: U.S. shale response + demand destruction + depleted SPR buffer → Brent retreats to $88–$92.
- Early 2027: Fed holds rates or hikes; core inflation drifts to 2.8%; S&P 500 forward P/E de-rates to 18.5x.
The bullish narrative—that "higher oil equals higher earnings for energy majors"—ignores the collateral damage. Energy sector weighting in the S&P 500 is just 4.2%. A 15% jump in energy earnings adds roughly 0.6% to index-level EPS. Meanwhile, consumer discretionary and industrial margins take a direct hit. Airline fuel costs rise $0.35 per gallon. Logistics carriers impose surcharges. Retailers absorb thinner margins or pass costs to households already running down pandemic-era savings. The net impact on aggregate corporate earnings is negative.
What's conspicuously absent from the headlines: any coordinated naval response. Washington has issued statements. Jordan and Egypt have expressed concern. No live-fire escorts, no expanded interdiction zones. The Bab el-Mandeb remains effectively contested, and insurance premiums for Red Sea transits have tripled since 2024, according to maritime risk data. That's not a temporary disruption—it's a structural tax on global oil logistics.
The market's reaction—S&P 500 down 0.8% Friday, NASDAQ off 1.2%, Small Caps dipping 1.5%—tells the real story. Risk assets are repricing for stickier inflation and a later Fed pivot. Call it what it is: a $100 headline that promises energy-sector fireworks but delivers broad-market stagnation. The rally won't last, and the hangover will hurt everyone except the oil tanker insurers.
🇪🇺 The ECB's Inflation Theater: Same Play, New Act
ECB held at 2.25% while Brent hit $100 and inflation prints 2.8%. Then they "signal" a September hike. Raising rates doesn't lower oil prices—it crushes demand for everything else. 🇪🇺 The transmission lag means 2.8% today becomes 3.4% by Q1 2027. Lagarde's crew is hiking into a conflict-driven supply shock with a tool that only destroys demand. French GDP contracted −0.7%. Polish growth came from defense exports (+60.5%), not consumers. The medicine stays the same while the diagnosis worsens. Two hikes priced in by February 2027. Growth at 0.8%. Another 25 bps pushes corporate lending above 4.3%. Who exactly benefits from this tourniquet?
The European Central Bank held its benchmark rate at 2.25% on July 23. The same day, Brent crude hit $100 a barrel. Eurozone inflation printed 2.8%. One day later, policymakers floated the possibility of a September hike. Christine Lagarde's crew wants the market to believe this time they mean business.
Why the Lag Matters
The sequence tells the real story. On July 23, the ECB confirmed no move. On July 24, they signaled a potential September increase. This isn't decisiveness—it's a carefully staged delay wrapped in geopolitical cover.
- July 23: Rate held at 2.25%. Brent crude hits $100/barrel. Eurozone inflation at 2.8%. Strait of Hormuz disruptions escalate amid Israel-Hamas attacks near the strait and US-Iran proxy violence.
- July 24: Policymakers "signal" a September hike may come.
- October (priced in): Markets expect the first of two hikes.
The ECB isn't reacting to inflation itself. It's reacting to the threat of inflation. In May, the ECB's own survey showed consumer inflation expectations jumped by 2.5 percentage points—a "double scar" the bank itself warned about, stemming from both the Iran conflict and Ukraine war. Lagarde's crew uses a Middle Eastern conflict they cannot control as a convenient excuse for action they should have taken months ago.
The Mechanics They Won't Admit
Energy prices surged in June. Fuel and gas costs have not yet fully transmitted into core consumer prices. That transmission lag—typically 3–6 months—means the 2.8% headline figure will look quaint by October. Oil at $100 adds roughly 0.4–0.6 percentage points to Eurozone CPI within two quarters, per standard pass-through models. Eurozone inflation already hit 3.2% in May before the latest energy leg.
Borrowing sensitivity tells a darker story. Investment demand is already easing. Another 25 basis points in September pushes Eurozone corporate lending rates above 4.3%, choking the fragile recovery. The ECB's own June 11 rate decision—the first hike since 2024, bringing the deposit rate to 2.25%—was accompanied by a GDP growth downgrade to 0.8% for 2026.
Consumer spending presents a paradox. Energy price surges accelerate nominal spending but crush real purchasing power. In France, INSEE reported GDP contraction of −0.7% in June, unemployment ticking up 0.3 percentage points toward 8.4%, and consumer purchasing power dropping. In Poland, where industrial production rose 4.1% quarter-on-quarter, the gains came from defense exports (+60.5%) and mining (+32.6%)—not from healthy consumer demand.
The ECB's own models demonstrate that external supply shocks—precisely what we're seeing—respond poorly to rate policy. Raising rates doesn't lower oil prices. It lowers demand for everything else, hoping the economy shrinks enough to offset imported inflation.
Confidence in the Forecast
High confidence: two hikes in 2026. The first came June 11 (deposit rate to 2.25%). A September follow-up (25 bps) and a February 2027 move (another 25 bps) are priced in. Markets have learned to front-run central bank theater.
What This Actually Enables
| Domain | Effect |
|---|---|
| Energy | Higher borrowing costs for grid infrastructure; Europe added 25.3 GWh storage capacity in June but project delivery delays begin Q3 2026 |
| Finance | Compression on bank net interest margins; deposit rates lagging loan rates; bond spreads widened beyond 150 bps |
| Economy | Industrial production contracts ~1.2% in H1 2027; unemployment ticks up; Eurozone growth projected at 0.8% for 2026 |
| Geopolitics | Euro weakens ~3% against USD, making imported energy even costlier—a self-defeating loop |
The OECD projected UK GDP growth at only 0.9% for 2026 and warned of a 1.8% output decline in 2027 if the Iran conflict persists. The ECB is applying a monetary tourniquet to an economy bleeding from a geopolitical wound. It works in textbooks. In Frankfurt, it just makes the bleeding slower—and more expensive.
The Real Numbers
- Current rate: 2.25%
- September target: 2.50%
- February 2027 target: 2.75%
- Inflation today: 2.8%
- Inflation in Q1 2027 (projected): 3.1–3.4%, assuming oil stays above $95
- GDP impact: −0.3% per 25 bps hike, concentrated in manufacturing and export sectors
The gap between what Lagarde says and what the data does keeps widening. Two years of "transitory" followed by "vigilant" followed by "data-dependent" has produced exactly one consistent result: inflation above target and growth below potential.
If You're Scoring at Home
The ECB is hiking into a conflict-driven supply shock. Oil at $100 doesn't respond to Frankfurt interest rates. German manufacturing PMIs are softening. French GDP contracted. Polish growth came from war matériel, not consumer demand. Yet the medicine remains the same.
September's hike won't fix inflation. It will validate the bond market's suspicion that central banks have no tool for energy supply shocks except demand destruction. The next six months will demonstrate whether the ECB prefers 3% inflation with 1% growth or 2% growth with 3.5% inflation.
They've already chosen. They just won't say it.

Comments ()