£9.8 Billion Gilt Exodus: UK Fiscal Stability Collapses Amid Leadership Vacuum
TL;DR
- £9.8 Billion Gilt Exodus: UK Fiscal Stability Collapses Amid Leadership Vacuum and Oil Shocks. Can the UK economy survive a £9.8 billion gilt sell-off and systemic leadership instability?
- 4.3% GDP Growth: China's AI Export Surge Masks Domestic Consumption Collapse. Is China's AI-driven export growth a sustainable recovery or just a statistical illusion masking a domestic economic crisis?
- 12.5% Tariffs: US-India Trade Pact Postponed Amid Rising Household Costs. Will the US-India trade stalemate result in a balanced treaty or simply increase costs for American households?
📉 The £9.8 Billion Gilt Fire Sale
£9.8 billion pounds. That is the staggering amount of capital fleeing UK Gilts in a single day 📉. That's roughly 100 million pounds every hour of the day. The government's math is crumbling while oil spikes and leadership vanishes. Is your portfolio ready for this instability?
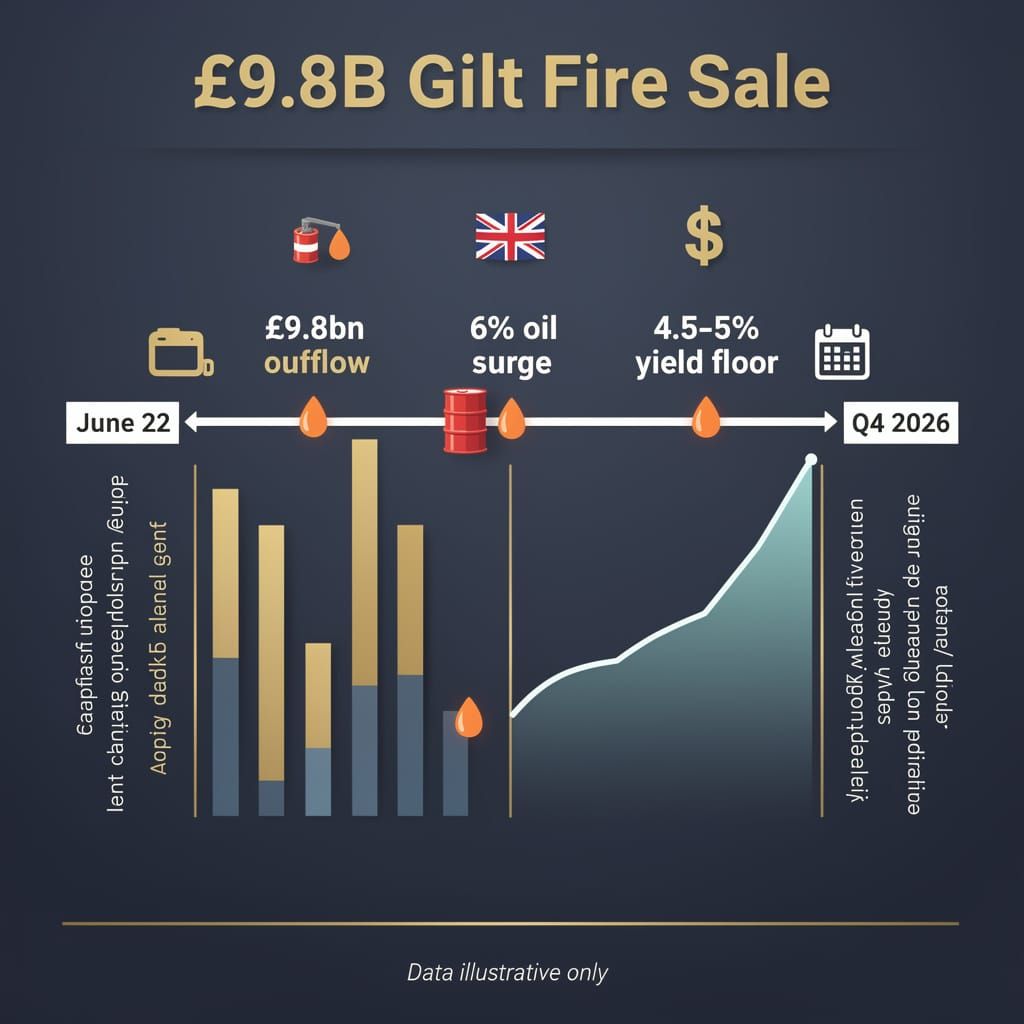
UK fiscal stability currently rests on a foundation of optimistic press releases and crumbling math. On July 14, 2026, the market replaced optimism with a £9.8 billion exodus from UK Gilts. This massive liquidation coincided with a macro risk cascade—including a 6% surge in oil prices on July 8 following tensions that threatened the Strait of Hormuz—pushing two-year gilt yields above 4.5%. Investors are signaling a total lack of trust in the government's ability to balance books amid a volatile transition following Sir Keir Starmer's resignation on June 22.
Why the Market Panicked?
The sell-off indicates a breakdown in the causal chain of fiscal trust. Chancellor Rachel Reeves’ strategy—which includes a £12,000 annual Cash ISA cap and a 22% tax on interest earned within non-cash Stocks and Shares ISAs effective April 2027—demonstrates a transparent attempt to coerce savings into equities to shore up revenue. This creates a "gilt premium," where investors demand higher returns to compensate for political instability and rising borrowing costs.
Yield Trajectory
- July 14, 2026: Gilt sales reach £9.8bn; yields spike as US-Iran hostilities accelerate.
- Q3 2026: Expected sustained upward pressure on borrowing costs due to regional conflict and leadership uncertainty.
- Q4 2026: Potential regulatory recalibration as the Treasury struggles with inflation inertia.
Systemic Failures
- Liquidity: Oil price volatility → institutional flight from sovereign debt to hedge against energy shocks.
- Capital Flows: Leadership shifts (Starmer to potential successors) → rapid erosion of Sterling stability.
- Credit: Global monetary tightening → reduced leverage capacity for gilt-heavy portfolios.
The Illusion of Resilience
The current distress echoes previous crises where reserves vanished overnight. While officials project stability, the data demonstrates a fracture in price discovery. The Bank of England has already been forced to intervene during previous gilt turmoil, yet the recurrence of yield spikes proves these interventions are mere bandages on a systemic wound.
Interest-bearing assets now weigh more than they carry. The government claims the economy is resilient, yet capital flows out with an efficiency that suggests the market has already reached its verdict. With the Federal Reserve facing internal divisions—where 17 of 32 insiders supported rate increases in June—the projection of rate hikes remains a looming threat. This environment ensures the 4.5% to 5% yield floor serves as a ceiling for any future UK economic growth.
📉 The Export Mirage
4.3% GDP growth—a statistical mirage. This is roughly equivalent to sprinting on a treadmill while the house burns down 📉. AI and EV exports are masking a domestic collapse. Can a nation survive when chips soar but citizens stop buying clothes? China — is your portfolio betting on a ghost economy?
China’s growth figure of 4.3% functions as a convenient headline, but the mechanics reveal a precarious dependency. While the IMF eyes 4.6%, this optimism ignores a structural imbalance: an economy sprinting on a treadmill of AI and electric vehicle (EV) exports while the domestic engine stalls.
A Tale of Two Economies?
The current expansion relies almost exclusively on external demand. High-tech exports drive GDP upward, yet this strength fails to penetrate the local street. The causal chain is clear: factories are prioritizing AI and chip components to front-run U.S. tariffs, resulting in a Manufacturing PMI of 50.3 and an export order sub-index of 50.1 as of June 30, 2026. US dollar exports surged 19.4% in Q2, specifically fueled by AI-driven tech.
However, this industrial success creates systemic employment gaps. The "China Shock 3.0" manifests as capital substitution where AI-powered systems displace human labor. While the state attempts to connect 12.7 million graduates with opportunities, the reality is a K-shaped divergence where industrial output rises 4.5% via AI investment while the workforce faces displacement fears and structural mismatches.
Domestic Friction:
- Retail Sales: 0.6% dip in May—the first monthly drop since December 2022—indicates a consumer base retreating from autos and appliances.
- Property: Real estate investment plummeted 16.2% (Jan-May), with secondary home prices falling up to 8.21% in second-tier cities by July 2.
- Investment: Urban fixed-asset investment contracted 4.1%, eroding the primary source of household wealth.
The Policy Pivot
Central banks now face the reality that tech-led growth does not translate into societal prosperity. The current strategy enables a statistical recovery without an economic one. The government's pivot toward vocational manufacturing is a belated admission that an AI boom cannot replace a cratering property market. Relying on the world to buy chips while citizens stop buying clothes is a statistical illusion.
Projected Trajectory:
- Q3 2026: Growth likely to stabilize at ~4.2%, as domestic consumption remains unclear.
- H2 2026: Heavy reliance on AI/NEV exports increases vulnerability to EU carbon tariffs and subsidy probes.
- 2027: Stagnation risk persists unless consumption decouples from export performance.
Sectoral Divergence:
- Tech/EV: High growth → Increased capital concentration and trade friction.
- Real Estate: Value collapse → Reduced household leverage and spending.
- Retail: Negative growth → Heightened risk of deflationary pressure.
💸 The Art of the Stall: US-India Trade Theatre
12.5% tariffs are a joke for leverage, yet US households pay a staggering $1,500 annual penalty 💸. India just postponed the trade pact, treating US threats as 'negotiable noise'. Is this diplomacy or just a costly stall? US taxpayers — how much more of this 'trade theatre' can you afford?
While diplomats project a narrative of "incremental progress," the July 13 meeting between Narendra Modi and Trump served as a masterclass in strategic inertia. India has formally postponed the signing of the U.S.-India trade agreement, transforming a proposed victory lap into a bureaucratic stalemate.
Performance or Policy?
Commerce Minister Piyush Goyal refutes claims of deliberate delays, yet the timing indicates a calculated gamble. While India recently signed a Free Trade Agreement with the UK, New Delhi is leveraging that safety net to ignore Washington's pressure. The U.S. is attempting to exert leverage via a Section 301 investigation into forced labor, proposing tariffs up to 12.5% on Indian imports—a rate sitting at the top of the 10%–12.5% bracket applied to 60 countries. India treats these threats as negotiable noise, formally rejecting the USTR’s claims on June 3 and demanding the investigation be dropped.
The Friction Points
- Labor Standards: USTR Section 301 probe → proposed 12.5% tariffs on forced-labor violations.
- Agricultural Protectionism: Mutual refusal to lower barriers → stalled sectoral access.
- Diplomatic Leverage: UK-FTA validation → reduced urgency for U.S. concessions.
The Economic Cost of Hesitation
This diplomatic attrition carries a tangible price for the American consumer. The Trump administration's broader tariff strategy—targeting 60 countries—is not a surgical strike but a blunt instrument. Tax Foundation estimates suggest an average annual cost of $1,500 per U.S. household, with Yale Budget Lab noting that lower- and middle-income families bear the brunt. Far from stabilizing prices, these policies compound existing pressures; energy-driven inflation already pushed the May CPI to 4.2%.
The Numbers
- 12.5%: Top-tier proposed U.S. tariff rate targeting forced labor violations.
- $1,500: Estimated average annual cost per U.S. household due to tariff policies.
- 4.9%: Indian industrial growth in April 2026, fueling New Delhi's protectionist confidence.
Timeline of Attrition
- June 3, 2026: USTR announces 10%–12.5% tariffs on 60 economies; India publicly rejects forced-labor claims.
- June 24, 2026: USTR Jamieson Greer meets Piyush Goyal in New Delhi to salvage the interim deal.
- July 13, 2026: Formal postponement of the trade pact; U.S. maintains punitive tariff proposals.
- July 24, 2026: Expiry of several Section 301 exclusions; critical deadline for a provisional agreement.
Despite the rhetoric of "uninterrupted dialogue," the causal chain demonstrates that India is playing hardball. Whether this results in a balanced treaty or a prolonged trade war depends on whether the U.S. views its 12.5% tariff as a genuine policy mandate or merely a failed tool for negotiation.



Comments ()