100% Debt-to-GDP: US Fiscal Crisis and Global Market Fragility
TL;DR
- 100% Debt-to-GDP: US Fiscal Crisis Triggers Emerging Market Fragility in Mexico. Can Mexico's internal economic growth survive the systemic risk of US debt and Middle East volatility?
- 100,000 Job Cuts: Volkswagen Germany Shuts 4 Plants Amid BYD Competition and Trade War. Can slashing 100,000 jobs and billions in investment save Volkswagen from Chinese EV dominance?
- $39 Trillion National Debt: US Fiscal Insolvency Hits Critical Threshold Amid Energy Shocks. Can the US economy survive a $39 trillion debt burden while the dollar loses its reserve status?
📉 The Geopolitical Premium: Mexico's Market Fragility
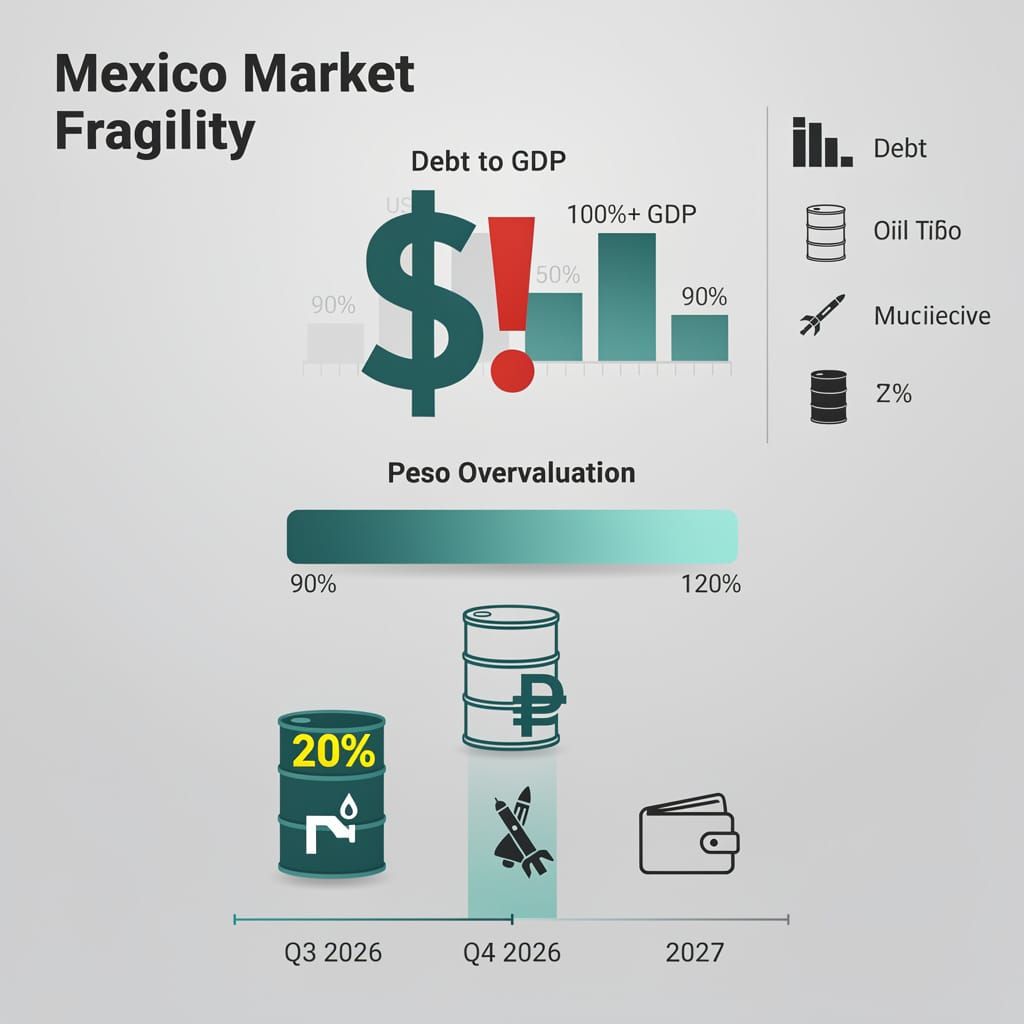
100% GDP debt in the US is a staggering WWII-level peak 📉. Mexico's 'stability' is a joke when a single Middle East spark drains liquidity instantly. Who cares about infrastructure plans when the peso is overvalued and the exit door is narrow? Investors in LATAM—are you actually buying this illusion?
Investors are currently pretending that benign macroeconomic indicators can shield the Mexican stock index from the volatility of U.S. foreign policy. The illusion of stability evaporates instantly when the U.S. and Iran enter a deadlock. This was evident on July 13, 2026, when missile exchanges and threats to the Strait of Hormuz—which controls ~20% of global oil and gas flow—triggered a cascade of declines, including a 10% tumble in Seoul’s Kospi by June 23 and a negative turn in foreign capital in the Philippines on July 13. While Mexico touts internal gains, these are irrelevant when geopolitical shocks trigger abrupt capital outflows.
Why Macro-Stability Fails?
The current market logic suggests that strong fundamentals, such as Mexico's $200B infrastructure plan, offset external risk. However, the causal chain proves otherwise: military threats toward Iran provoke defensive positioning, resulting in immediate liquidity drains from emerging markets.
Simultaneously, the U.S. Treasury market is under severe strain. On June 30, 2026, U.S. federal debt officially surpassed 100% of GDP, the highest level since WWII. This fiscal overhang, coupled with a 2025 sovereign rating downgrade by Moody's, increases borrowing costs and systematically erodes the profit potential that once attracted speculative capital to secondary markets.
Currency & Risk Factors:
- USD/MXN: A May 26 assessment showed a widening gap between the Banxico rate of 17.32 MXN and an implied rate of 18.02 MXN, indicating the peso is overvalued by ~4%.
- Liquidity: Risk aversion triggers rapid exits, as seen in the broader regional sell-offs following the July 13 instability.
- Regulation: With U.S. debt trajectories potentially reaching 120% of GDP, institutional investors are forced into defensive hedges, reducing the appeal of emerging market equity.
The Projected Path
Market participants are managing volatility rather than implementing systemic changes, leaving the index exposed to the next headline from the Middle East, where prediction markets now show a 19.5% chance of a U.S. invasion by year-end.
- Q3 2026: Increased currency volatility as the peso struggles to align with implied market valuations.
- Q4 2026: Potential for further index declines if U.S.-Iran retaliation escalates into total trade disruptions.
- 2027 Forecast: Persistent capital outflows likely unless the risk premium decreases and U.S. fiscal reforms occur.
Market Pressures:
- Political: U.S. missile strikes → heightened foreign-risk environment.
- Monetary: Banxico rate holds → vulnerability to carry-trade unwinding.
- Structural: Infrastructure spending → insufficient to offset systemic geopolitical volatility.
📉 The Cost of Survival: Volkswagen's Restructuring Gamble
1000,000 jobs gone. A staggering sacrifice for a "flicker of stability" 📉. That's roughly 4 entire small cities' worth of employment deleted. VW is slashing 15% of investment to fight BYD's cost edge. A strategic shift or just managing a decline? German workers — is this the price of survival?
Volkswagen's supervisory board has authorized a restructuring plan that trades 100,000 jobs for a flicker of stability. On June 26, 2026, the board approved the closure of four German plants—Hanover, Zwickau, Emden, and Neckarsulm—alongside the cessation of production at the Frankfurt hub. This isn't a strategic evolution; it is a retreat triggered by a 44-point dip in yearly margins and the fallout from a US-EU trade dispute, including a proposed 25% tariff on European automobiles.
Can Efficiency Erase Structural Inertia?
CEO Oliver Blume frames this collapse of employment as a strategic necessity. The logic indicates that slashing the workforce by six figures and trimming five-year investment by 15% to €130 billion will resolve inefficiencies inherent in the restrictive Volkswagen Act. This is an optimistic fantasy. Management is attempting to offset high operational costs and the reality that BYD's vertical integration enables a 15% to 22% cost advantage, pushing VW's share in Germany's plug-in hybrid market below 15% as BYD surges.
Lower Saxony’s 20% stake, once the primary barrier to such cuts, has shifted from a shield for workers to a forced conduit for concessions. While the state historically blocked shutdowns, current financial pressure results in a reluctant green light. The company points to leasing declines, but the causal chain is simpler: a failure to compete with Chinese rivals who recorded double-digit sales growth in the UK and Europe in early 2026.
Operational Impacts
- Labor: Up to 100,000 positions eliminated → contributes to a projected decline of up to 1.3 million European automotive jobs.
- Infrastructure: 4+ plants closed → immediate dislocation and lowered goodwill among long-term partners.
- Financial: Investment slashed to €130bn → target of €1.5 billion in annual savings by 2030.
The Road to 2030
Management projects a lean recovery, yet the plan to reduce output and substitute manual technicians with IT staff suggests a company managing decline. Projections of stability by 2030 assume the board can bypass the hostility from trade unions and legislative bodies.
- 2026–2027: Execution of closures and voluntary departures of 20,000 German staff, triggering widespread union resistance.
- 2028–2029: Attempted production normalization amid intensified EU tariff pressures and a ~9% YoY decline in vehicle deliveries.
- 2030: Theoretical stabilization of earnings, provided the brand survives the structural transformation of the German automotive sector.
Strengths vs. Weaknesses Strategic Refocusing: Leaner operation → desperate attempt to match BYD’s pricing and scale advantage. Worker Relations: Forced concessions → heightened hostility and systemic strike risks. Governance: Lower Saxony's shift → collapse of political protection for German labor. Market Position: Cost-cutting → reactionary defense against Chinese manufacturers bypassing tariffs via Hungarian plants.
💸 The Great Deleveraging: A Masterclass in Systemic Failure
$39 trillion debt is a catastrophic joke, equivalent to nearly $130k per citizen 💸. The 'safe haven' is leaking as interest eats 32.5% of revenue. A soft landing or a slow-motion erasure of the fiat experiment? US taxpayers — are you still buying the delusion?
Market analysts spent years projecting a "soft landing" right up until the runway disappeared. While the narrative suggests a sudden collapse, the data indicates a slower, more pathetic erosion. The "severance of the energy-dollar nexus" isn't a sudden event; it is a documented slide. By June 30, 2026, the U.S. fiscal deficit worsened as the government monetized deficits via rapid bond issuance to absorb shocks, proving the system didn't crash—it leaked until it was empty.
Why the "Safe Haven" Narrative Failed?
The Federal Reserve’s playbook assumes a geopolitical stability that vanished in May. The "supply shock" was a self-inflicted wound; U.S. strikes on Iran in late May and military operations on Qeshm Island triggered oil price spikes and extreme volatility. By July 7, the U.S. national debt hit $39 trillion, a fiscal shell game where interest payments now consume roughly 20% of federal revenue. The "debt call" is a present reality where the debt-to-GDP ratio has surpassed 100% and is projected to reach 120% under current trajectories, moving toward a systemic insolvency threshold.
The Decay Timeline
- May 2026: U.S. strikes on Iran and Strait of Hormuz closures trigger oil spikes; markets drop 9.3% from all-time highs.
- June 22, 2026: USD depreciation accelerates as fiscal deficits—projected at $2 trillion for FY2026—destabilize reserve status.
- July 7, 2026: National debt reaches $39 trillion, with interest payment ratios hitting 32.5%, the worst level since 1996.
- July 14, 2026: Systemic fragility peaks as the gap between debt service and revenue becomes mathematically insurmountable.
The Math of Ruin
The correlation between energy costs and solvency remains absolute. We aren't seeing a theoretical real-value loss, but the mundane cruelty of regional spot price surges—up to 243% in New England—while wholesale prices fluctuate wildly from $45/MWh to $600/MWh.
Fiscal Realities:
- Debt Burden: ~$39.1 trillion total → interest costs outstripping national priorities.
- Currency: Shift toward gold/RMB → reduced trust in USD reserves amid sovereign rating downgrades.
- Energy: Extreme volatility (Brent spiking then sliding to ~$78.58) → increased household credit stress.
This isn't a "bear market"; it is the slow-motion erasure of the fiat experiment. The delusion that Western institutions can pivot when the primary reserve currency is a $39 trillion liability demonstrates a profound detachment from the balance sheet. The indices aren't measuring value; they are simply recording the velocity of the decline.



Comments ()