91% Small Business Uncertainty: US Industrial Sector Faces Systemic Freeze Amid Supply Chain Collapse
TL;DR
- $73.82 Average Cookout Cost: US Protein Crisis Hits 70-Year Lows. Can temporary retail discounts mask a structural collapse in US cattle supplies?
- 91% Uncertainty Index: Small Business Optimism Plummets Amid Middle East Trade Shocks. Is market resilience just a buzzword for managed decline in the current economic climate?
- 2.15% Sensex Crash: Fed Hawkishness Triggers Massive Capital Flight in India. Is the Indian market rally just a fragile illusion masking a deeper dependency on US Federal Reserve policy?
💸 The Barbecue Tax: Inflation's Grip on the Fourth
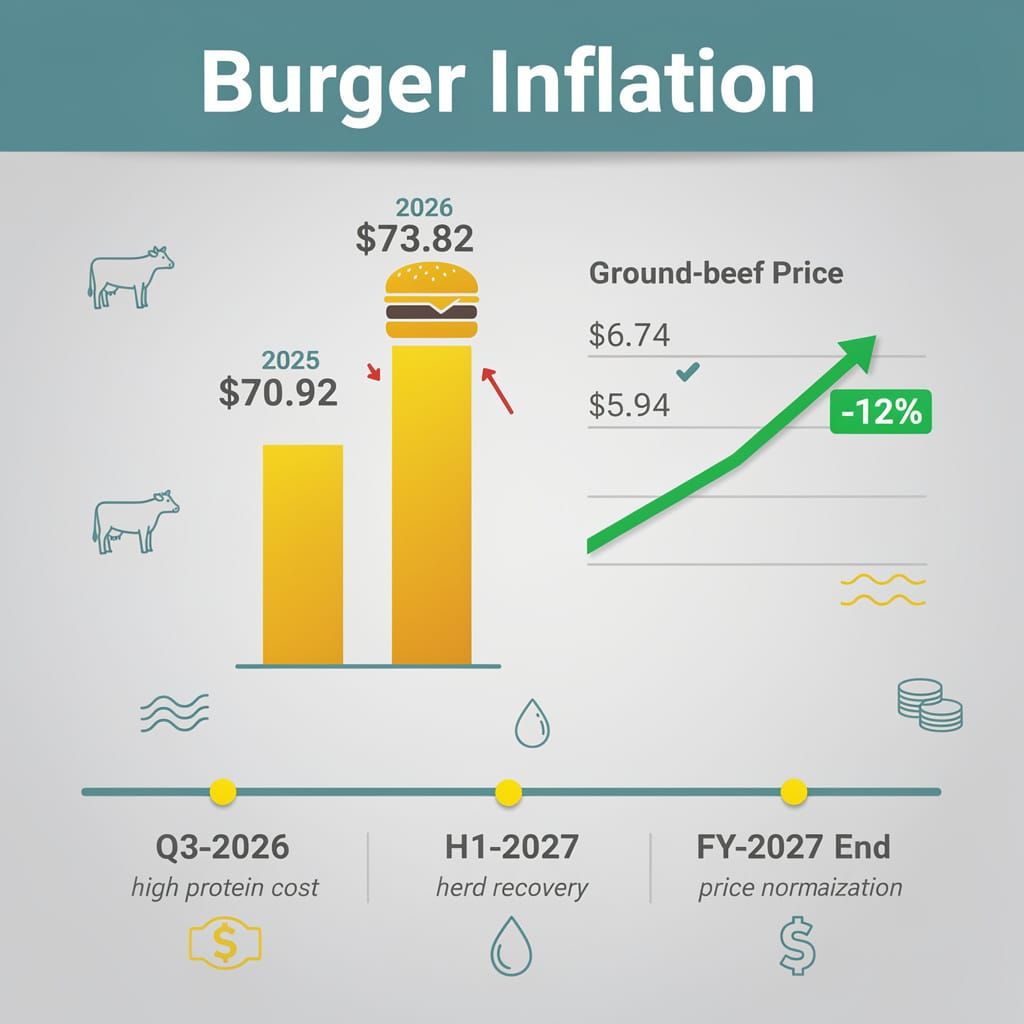
$73.82 for a burger? Obscene. That's a $2.90 hike since 2025 💸. Walmart's 'rollbacks' are just cosmetic politics while cattle herds hit a 70-year low. A temporary discount doesn't fix a collapsed supply chain. US Consumers—is your wallet feeling this 'anniversary' relief?
The American Farm Bureau Federation reports that the typical July 4th cookout now costs $73.82, a 4% increase over 2025 levels. While some analysts point to inflation-adjusted purchasing power gains, the nominal $2.90 hike demonstrates a persistent volatility in agrifood commodities, particularly in canned pork and beans, which saw the steepest price climbs.
Does Retail Intervention Matter?
Walmart reduced prices on over 250 items on July 6, including ground beef (dropping from $6.74 to $5.94/lb), in a move closely aligned with political rhetoric surrounding the U.S. 250th anniversary. This "rollback" functions more as a coordinated political-economic signal than a systemic remedy. The strategy fails to address the underlying causal chain: drought conditions have reduced U.S. cattle supplies to levels unseen since the 1950s, driving ground beef prices up approximately 12% and pushing average steak prices to a record $12.80 per pound.
Supply Chain Friction
- Livestock Constraints: 70-year low herd sizes → critical protein shortages → processing plants operating below full capacity.
- Retail Pricing: Targeted 250+ item discounts → temporary consumer relief → political alignment.
- Consumer Expenditure: $73.82 average meal cost → increased household spending pressure.
Market Dynamics
- Retailers: Use anniversary-driven cuts to drive foot traffic → defense of market share.
- Consumers: Pay record premiums for beef → robust demand among younger demographics despite cost.
- Producers: Face thin margins (~$0.12 per $1 consumer spend) → structural revenue strain.
The Path to Normalization
Industry data indicates these costs are a structural failure rather than a seasonal anomaly. Because cattle require long rearing periods to mature, the biological lag prevents immediate recovery. Normalization remains unlikely in the short term, as drought-induced scarcity sustains elevated pricing floors.
- Q3–Q4 2026: Persistent high protein costs as supply constraints endure through the winter season.
- H1 2027: Gradual stabilization contingent on herd recovery and climate-resilient transport adoption.
- FY 2027 End: Potential price normalization, provided structural industry reforms and farm bills address producer margins.
This cycle indicates that the relief offered by big-box retailers is a cosmetic correction. The fundamental economic reality remains that the cost of a burger is no longer tethered to efficiency, but to a fragile agrarian system unable to meet basic seasonal demand.
📉 The Illusion of Stability
91% Uncertainty Index: Small businesses are suffocating, not "rebalancing" 📉. This is equivalent to a systemic freeze in growth. Middle East chokepoints now dictate trade via "service fees." Stability or managed decline? Small business owners—how are you surviving this?
Market communications from June to July 2026 suggest a recurring theme: the strategic use of "uncertainty" to mask systemic volatility. While institutional portfolios claim to be "rebalancing," the reality indicates a reactive scramble. The narrative of resilience is increasingly contradicted by eroding margins and geopolitical shocks.
Who is Actually in Control?
The industrial sector remains tethered to erratic fuel markets. In June, the NFIB reported a Small Business Optimism Index of 95.3—below the 98.0 historical average—with the Uncertainty Index climbing to 91. While the BLS reported a marginal addition of 3,000 manufacturing jobs in June, this nominal gain barely masks the structural squeeze. Small businesses are not "rebalancing"; they are suffocating under record-low job creation plans and soaring labor costs.
This instability extends to commodities, where "stability" is merely a pause between shocks. Gold futures may have fluctuated, but the death of Iran's Supreme Leader Ayatollah Ali Khamenei on July 4, following U.S./Israeli air strikes, demonstrates that the market reacts to chokepoints, not data. The subsequent proposal for a "service fee system" for the Strait of Hormuz crossing signals a shift from open trade to a pay-to-play maritime economy.
Sector Vulnerabilities
- Commodities: Gold/Antimony volatility → safe-haven demand triggered by Middle East conflict.
- Healthcare: ZUNVEYL trial risks → precarious dependency on narrow approval pathways.
- Logistics: Fuel spikes + Strait of Hormuz fees → systemic supply chain fragility.
The Biotech Gamble
Pharmaceutical firms continue to utilize "risk factor" disclosures to soften the blow of potential failures. The June 16 disclosure regarding ZUNVEYL clinical trials reveals a precarious dependency on study enrollment, yet frames these as "forward-looking statements." This linguistic gymnastics allows firms to maintain valuations while avoiding concrete milestones, a practice criticized by researchers like Dr. Satoshi Yamada for favoring correlation over causation.
Projections for Q3 2026
Rather than a recovery, the trajectory indicates defensive stagnation driven by persistent cost pressures and tightening monetary policy.
- July–August 2026: Heightened hedging in rare earth metals as Iran-Qatar trade resumes amid a fragile diplomatic thaw.
- September 2026: Expected volatility in healthcare equities as the market demands RCT validation over vague risk disclosures.
- Q4 2026: Downward industrial revisions are probable, as the Fed and ECB maintain tight stances to combat energy-driven inflation, with core PCE inflation reaching 3.3% in April.
This cycle of selective disclosure enables firms to avoid accountability for poor forecasting. Until regulatory bodies enforce transparency on input cost exposure, "market resilience" remains a convenient buzzword for managed decline.
📉 The Fragile Rally: A Lesson in Market Amnesia
2.15% crash in a single session! 📉 That's a brutal wake-up call for those celebrating a "technical balance" based on a tiny ₹243cr FII pivot. One Fed minute and the rally vanishes. 🤡 Over-leveraged portfolios meet hawkish reality. Indian investors — how long will you ignore the Fed's shadow?
Equity markets recently demonstrated a textbook case of short-term memory. On July 7, 2026, the Sensex and Nifty indices staged a modest rebound, climbing 176 points to 78,461.16 and 34.1 points to 24,464.45, respectively. This sudden optimism relied on the thin premise of crude oil stabilizing at $69 per barrel—a drop of $4—and a negligible ₹243.03 crore pivot by foreign institutional investors (FIIs). The market labeled this "restored technical balance," ignoring that the rally was merely a trailing echo of the June 16 Strait of Hormuz reopening agreement.
A Forty-Eight Hour Correction?
The illusion of stability evaporated by July 9, 2026. Federal Reserve signals—specifically the July 8 release of FOMC minutes revealing a hawkish bias and revised dot plots—triggered an immediate reallocation of capital. The Sensex plummeted 2.15% to 76,998.54, while the Nifty retreated 2.12%. This shift demonstrates that investor confidence was not "restored," but merely suspended while waiting for the Fed to inevitably tighten.
Capital Flight Dynamics:
- FII Behavior: Transitioned from a marginal buy of ₹243.03 crore (July 7) to a total investment pause (July 9).
- Sector Exposure: Large-cap technology clusters, specifically Infosys, HCL Tech, and TCS, absorbed the primary impact of the sell-off.
- Energy Volatility: While OPEC+ targeted a July output increase of ~188k bpd, these gains are neutralized by the moment the Fed signals tighter credit.
Systemic Fragility
The rapid reversal indicates a dangerous correlation between central bank signals and emerging market instability. The 2.15% single-session drop in the Sensex is particularly damning when viewed against the backdrop of a U.S. labor market adding 172,000 jobs on July 2 and CPI remaining stubbornly above 4% as of July 14. This suggests portfolios are over-leveraged and treat every Fed signal as a systemic shock rather than a scheduled adjustment.
Current Market Indicators:
- Volatility: High; driven by the gap between geopolitical "peace" and monetary tightening.
- Liquidity: Low; FIIs exhibit a "flight to safety" pattern as the dollar strengthens on hawkish Fed minutes.
- Sentiment: Divergent; a widening gap exists between AI-driven corporate guidance and actual shareholder behavior.
Projected Outlook:
- Immediate Term: Continued volatility as markets digest the July 28–29 FOMC decision.
- Mid Term: Portfolio restructuring to reduce reliance on large-cap tech volatility.
- Next Milestone: High sensitivity to wage growth data; confidence wanes unless GDP prints stronger than projected seven times annualized.



Comments ()