5.5% PCEPI Inflation: US Markets Rally on Fragile Truces Amidst GDP Slump
TL;DR
- 5.5% Inflation vs. 1.6% GDP: US Markets Rally on Fragile Geopolitical Truce. Is the current stock market rally a genuine recovery or just artificial life support masking systemic economic rot?
- 30% Transfer Gap: OECD Normalizes Tax Models to Counter Spurious Inequality Narratives. Does selective data omission in wealth reporting create a false narrative of systemic inequality?
- ₦1.854 Trillion Budget: Rivers State Ends Legislative Paralysis Amid Fiscal Vulnerability. Can a ₦1.854 trillion budget actually deliver resilience for Rivers State, or is it just a procedural formality?
📉 The Bailout Bounce: Markets Rally on Artificial Life Support
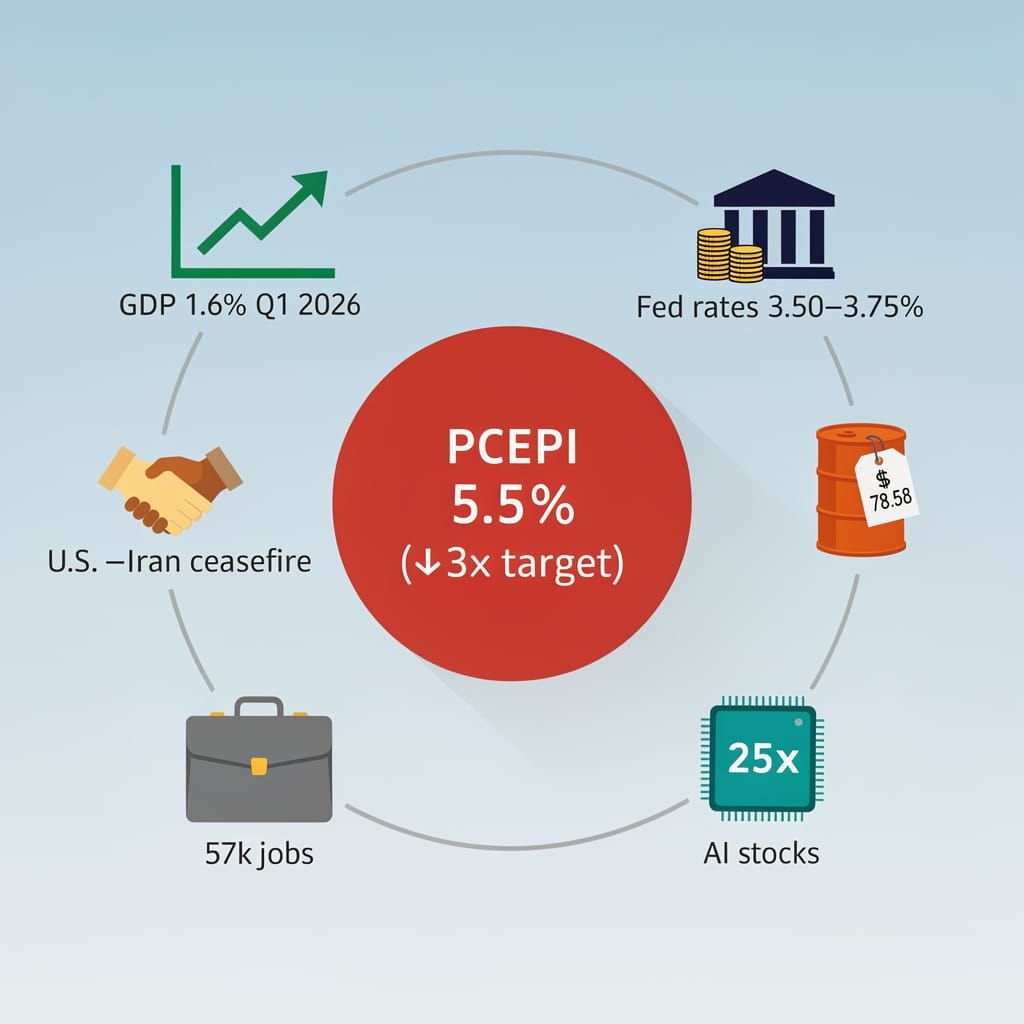
5.5% PCEPI inflation is a brutal wake-up call, nearly 3x the target 📉. The rally is a parlor trick fueled by fragile truces while GDP crawls at 1.6%. Is this a recovery or just artificial life support? Retail investors are diving in—are you ignoring the systemic rot?
Stock indices closed July 10, 2026, with a modest rebound, though the "bullish recovery" narrative ignores a grim reality. While indices ticked up, the Federal Reserve remains aggressively hawkish. Federal Reserve Chair Kevin Warsh confirmed inflation persists above the 2% target, with the May PCEPI hitting 5.5% annually in May. While some project stability, the median FOMC member now projects the federal funds rate will be 25 bps higher by the end of 2026, with several members eyeing hikes of 50 to 75 bps. This isn't a sign of health; it is a reaction to volatility fueled by a fragile geopolitical truce.
Growth or Intervention?
The current trajectory relies on a desperate causal chain: geopolitical instability triggers panic, followed by diplomatic crumbs—like the U.S.-Iran interim agreement—which temporarily depress inflation risk. This enabled Brent crude to slide toward $78.58/bbl by late June as traders bet on the reopening of the Strait of Hormuz. Such maneuvers inflate asset prices despite anemic growth, evidenced by a U.S. GDP projection of only 1.6% for Q1 2026.
Corporate earnings appearing to "beat" estimates is a parlor trick of lowered bars. While some energy firms report revenue growth—such as Energy Services of America Corporation's 21.5% increase—these gains are concentrated. The rally primarily benefits a concentrated elite while the broader economy suffers from a core PCEPI of 3.9% and energy costs that surged 24.3% year-over-year in May, eroding actual consumer purchasing power.
The Rally Mechanics
- Geopolitics: U.S.-Iran interim pact → Brent crude drops to ~$78/bbl → temporary dip in inflation risk.
- Earnings: Selective beats in Energy/IT → perceived strength → aggressive retail reallocation.
- Policy: Fed holds rates at 3.50%–3.75% → temporary relief → equity rotation despite a 70.4% combined market probability of a 25–50 bps hike in December.
Market Performance Metrics
- Price Action: S&P 500 recovered 1.8% on July 6 following dismal non-farm payrolls (57,000 jobs).
- Valuation: AI-related stocks trade at 25x multipliers, far exceeding the 15x historical norm.
- Employment: Sub-consensus job growth indicates systemic weakness masked by index gains.
Strategic Outlook
- Q3 2026: Volatility spikes as the July 29 Fed decision looms without forward guidance.
- Q4 2026: Stabilization depends entirely on the durability of the Iran ceasefire and oil stability.
- 2027: High risk of correction as the gap between 1.6% GDP growth and AI-inflated valuations becomes untenable.
Systemic Vulnerabilities
- Valuations: Disconnected from GDP → extreme sensitivity to rate hikes.
- Labor Market: 57k payrolls → eroding consumer purchasing power.
- Inflation: PCEPI at 5.5% → forces hawkish Fed policy regardless of market sentiment.
📉 The Arithmetic of Convenience
30% of Americans make financial transfers annually—a massive blind spot 📉 equivalent to ignoring entire demographics in wealth models. Selective subtraction creates a fake narrative of 'systemic theft'. OECD fixes the math, but the drama persists. Mid-class taxpayers — do you feel the 'theft' or the data gap?
Equity framing in modern economics frequently functions as a selective exercise in subtraction. The ongoing friction surrounding the Wealth Redistribution Score (WRS) demonstrates how omitting specific demographic cohorts enables a narrative of systemic theft, regardless of the underlying data.
Who is Missing from the Equation?
The controversy intensified when a Jacobin editorial on October 7, 2025, accused Ambrose Gethein’s WRS analysis of omitting critical demographic cohorts to mask inequality. This critique leaned on a 2022 AMP study that omitted net receipts for undeprived families and child allowances, effectively biasing its inequality metrics by ignoring non-working relatives.
This erasure of the retirement cohort and child benefits results in a suppressed Gini coefficient. The causal chain is predictable: remove the beneficiaries of state transfers, and the perceived gap between the elite and the working class widens artificially. Recent data from the Richmond Fed (July 8, 2026) underscores this blind spot, revealing that 30% of Americans made financial transfers last year—mostly parental gifts—and 25% engaged in time transfers like caregiving, contributions that traditional WRS models conveniently ignore.
The Correction Cycle
Institutional responses typically lag behind the viral nature of politicized narratives. It took until June 5, 2026, for the OECD to publish normalized tax-wedge models that finally treated employer-sponsored health premiums as quasi-taxes and incorporated child benefits. These updates demonstrate that U.S. and Nordic mid-class tax burdens align more closely than the "spurious" models suggested.
- Oct 2025: Jacobin and Lazardi leverage omitted-cohort data to frame equity gaps as elite theft.
- Nov 2025: Researchers restore retired worker cohorts to stabilize Gini interpretations.
- Jun 2026: OECD releases normalized models incorporating healthcare and child benefits.
- Jul 2026: Market volatility—marked by a 9.3% drop from all-time highs in May—and climate-driven supply chain risks overshadow domestic fiscal debates.
Analysis of Disconnect
Methodology: Omission of non-working populations → Artificial inflation of inequality metrics. Institutional: Slow OECD response → Prolonged dominance of unverified narratives. Political: Focus on "wealth theft" → Stagnation of actual fiscal reform.
Despite technical corrections, the political utility of flawed data persists. The episode indicates that narrative-driven economics bypasses peer-reviewed replication. Without a mandatory requirement for cohort-complete data, the market for convenient statistics will continue to thrive, ensuring policy remains stagnant while the models are corrected in retrospect.
🎭 The Theatre of Fiscal Restoration
₦1.854 trillion—a staggering sum equivalent to nearly 2 trillion naira in 'resilience' 🎭. After a masterclass in dysfunction, the legislature is back just in time to legalize the spending. Is this governance or just synchronized optics? Rivers State residents—do you trust this sudden fiscal miracle?
Rivers State has finally decided that governing requires a legislature. After a prolonged hiatus characterized by impeachment dramas and executive impersonation scandals, Governor Siminalayi Fubara submitted the 2026–2028 Medium-Term Expenditure Framework (MTEF) on June 25, 2026. This was followed by the formal presentation of the ₦1.854 trillion "Budget of Resilience for Growth and Development" on July 10, effectively ending a period of legislative paralysis that served as a masterclass in administrative dysfunction.
Stability or Synchronized Optics?
The administration presents this rollout as a victory for continuity. By reconvening the House of Assembly, the state transforms a legal bottleneck into a procedural formality. The claim that estimated revenues of ₦1.91 trillion—derived from combined internal generation and federal allocations—cover all line items upfront suggests a sudden immunity to inflation. This assertion ignores the reality of fiscal dependency; mirroring broader trends where federal transfers now comprise 33.5% of state outlays, such reliance typically enables unsustainable commitments rather than genuine resilience.
The Recovery Timeline
- June 25, 2026: MTEF submission and House of Assembly reconvening, ending the impeachment-driven lockout.
- July 10, 2026: Presentation of the ₦1.854 trillion Appropriation Bill to the Rivers State House of Assembly.
- Q4 2026: Projected budget implementation following legislative review to eliminate fiscal fragmentation.
The Institutional Ledger Legislative: Return of lawmakers → restoration of budgetary approval processes. Administrative: 50% boost in ministry overhead → presumed resolution of agency bottlenecks via increased spending. Fiscal: ₦1.405tn capital project allocation → theoretical mitigation of infrastructure deficits.
While the state celebrates the end of civil unrest, the transition from "crisis management" to actual governance remains a performance. The projected Q4 implementation targets a reduction in fiscal fragmentation, yet increased administrative complexity often drives sustained spending challenges. The restoration of legislative access does not inherently result in fiscal discipline; it merely enables the legal expenditure of funds. While the alignment of timelines with federal proposals is portrayed as stabilizing market risk, it mirrors a systemic shift toward federal dominance that increases long-term fiscal vulnerability.



Comments ()