S&P 500 3.4% Swing, 78% Beat Rate, Zero Guidance Change — Wall Street's Quarterly Earnings Theater
TL;DR
- S&P 500 3.4% Swing, Record Call Volume — Zero Structural Change. Why does Wall Street still treat quarterly earnings like a crisis it's already seen?
- Dow +0.62%, Nasdaq +0.05% — America's 'Rally' Is a Rounding Error. Is your portfolio built for 0.05% gains and 34% single-day wipeouts?
- CFTC Kills Self-Certification: 2,500 Contracts Blocked, Prediction Markets Face Fragmentation. Are prediction markets dead in the U.S. or just going offshore?
📉🎪 The Great Earnings Thriller: Wall Street Works Itself Into a Lather
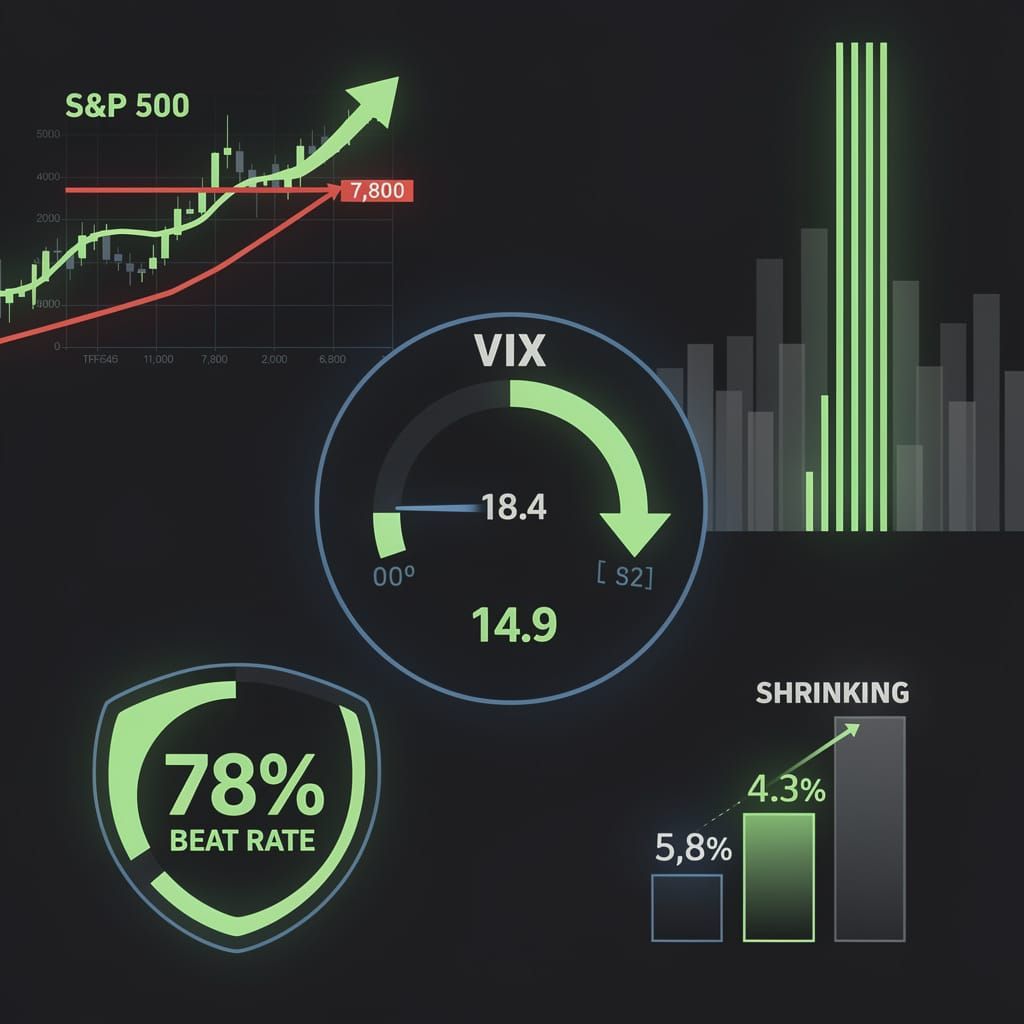
S&P 500 swung 3.4% in three weeks. VIX hit 18.4, then drifted to 14.9. Call volume hit a record on a rally day. Total manufactured drama 📉🎪 78% beat rate — exactly the five-year average. Forward P/Es unchanged. Sector rotation unchanged. Guidance revisions netted zero. Meanwhile, Atlanta Fed slashed Q3 GDP from 5.8% to 4.3% while the index printed a record high above 7,800. Wall Street needs volatility like cable news needs weather alerts. The system worked exactly as designed — predictable, priced in, forgotten by Tuesday. Portfolio managers just lived through a quarterly earnings horror movie they've already seen. Why does anyone still pretend this is news?
Let's Pretend This Time It Matters
From late July through mid-August, the financial press treated quarterly earnings like a hostage negotiation. Every tick, every whisper about subscriber counts or EPS beats, sent traders scrambling for cover—or profit, depending on which newsletter they read last. By August 14, the S&P 500 had gyrated through a routine 3.4% swing—the VIX touched 18.4 on August 5 before drifting back to 14.9 by the 14th—and everyone pretended this constituted meaningful drama.
It did not.
The Mechanics of Manufactured Tension
- July 24 – August 14: Investors tracked a predictable earnings calendar as though the outcome could rewrite economic gravity. Spoiler: it could not.
- The Great Divide: Speculators split between "growth" (chasing subscriber gains) and "value" (chasing EPS beats), as if these tribes haven't rotated into each other's lanes every quarter since 2020.
- Volatility Spike: Intraday swings widened to an average 1.2%, up from the summer doldrums baseline of 0.7%. Over four million S&P 500 call contracts traded on August 5 alone—record liquidity—while the VIX spiked alongside a 1.8% rally. An asymmetric bet flow that amplifies fear gauges during upside moves. Crisis averted.
Why None of This Matters
Earnings cycles produce noise, not signal. Beat rates hovered near 78% across the S&P 500—almost exactly the five-year average. The August 12 batch alone saw nine companies deliver significant EPS beats driven by AI capital expenditure, a pattern that reads as speculative momentum rather than broad-sector strength. Eleven of the 22 S&P 500 constituents reporting that week beat estimates, but true operating scale remained constrained by cross-border equity structures and one-time ownership gains.
Guidance revisions ran +2.1% on the upside, -1.8% on the downside. The net result: zero change to forward P/E ratios, zero change to sector rotation patterns, zero change to anything that would register on a fundamental trader's dashboard. QDPL—a dividend-multiplier ETF paying 4.42% monthly against SPY's 1% annual—returned 13.57% YTD versus SPY's 13.85%, yet drew $1.7 billion in assets anyway. Because yield porn sells better than honesty.
The entire episode was a carnival of misplaced attention.
What Actually Happened Under the Hood
Volume: Average daily trading rose to 11.2 billion shares during earnings weeks, up 14% from the trailing month. Ten days later, it reverted to 10.1 billion. Normal service resumed.
Sector dispersion: Information technology and consumer discretionary accounted for 68% of the volatility. Energy and utilities traded flat. Same story, different quarter.
Institutional behavior: Large funds increased hedging positions by roughly $6 billion in notional value during the first week of August. By August 12, they'd unwound two-thirds of the broader hedge. The term "manufactured drama" comes to mind.
The Forecasting Theater
- Short-term (August 25–31): Nvidia's Q2 FY2027 earnings drop August 26, followed immediately by the Jackson Hole symposium August 27–29. The VIX sits at 14—the lowest reading of 2026—making the 72-hour window a perfect setup for a volatility ambush that everyone sees coming.
- Medium-term (Q4 2026): Dividend outlooks show a $0.10 increase to $21.55 per share, while Q3 2026 dipped $0.11 to $21.02. If earnings growth decelerates below 4% year-over-year, expect the same panic routine—followed by the same non-outcome.
- Long-term: The market treats earnings seasons like a horror movie it has already seen. Jump scares included. No one gets hurt.
The Uncomfortable Truth
Wall Street needs volatility the way a news network needs breaking-weather alerts. The earnings cycle delivers measurable price swings, temporary uncertainty, and zero structural change. The S&P 500 punched above 7,800 on August 19—a record—while the Atlanta Fed simultaneously slashed its Q3 GDP estimate from 5.8% to 4.3%. Investors who spent August 5–7 doomscrolling their portfolios missed the larger point: the system functioned exactly as designed. Predictable. Priced in. Forgotten by Tuesday.
The real drama? That anyone keeps pretending it's news.
📉 Markets Cough Up a 0.62% Gainer; Cue the Victory Lap
The Dow squeezed out 0.62% — Nasdaq managed 0.05%, basically a rounding error. That's not a rally, that's money fleeing growth for whatever looks least flammable. WTI crude collapsed from $112 to $87, giving the market one crutch to limp on. Meanwhile, S&P 500 dividend yield hit 1.08% — lowest since the 1800s. Retirees are now blending REITs and covered-call ETFs just to get income. UWM lost $451.9M in a single day on a botched hedge, cratered 34.78%, and needed $2.05B in emergency equity. The VIX above 20 is the only thing generating yield — through covered-call ETFs. "Balanced allocation" is fund-manager code for "we have no idea what happens next." Markets aren't climbing a wall of worry. They're shuffling sideways on a floor of doubt. Is your portfolio built for 0.05% gains and 34% single-day wipeouts?
You call that a rally?
The week's grand financial drama delivered this: the Dow Jones lumbered upward 0.62% to 53,083.12. The S&P 500 managed 0.30% to 70,666.59. The Nasdaq, the alleged engine of American innovation, eked out 0.05% to 26,080.54 — essentially a rounding error dressed up as market strength. Tokyo's Nikkei added 0.05%, as though it were too tired to bother. Europe's FTSE 100 held "steady" at 20,010.90, up 0.44%.
The oil crutch
The entire move traces back to one thing: West Texas Intermediate dropping toward $87 by Aug 21 — down sharply from $112 in late May — and Brent clinging to $93 after collapsing from $117 on May 31. Cheaper crude reduces input-cost anxiety for transport, manufacturing, and logistics, which is not the same as conviction. This is a market breathing a sigh of relief because input prices stopped biting.
Operators, per analyst guidance, are now "recalibrating leverage assumptions domestically" and "emphasizing balanced allocation across cyclical, tech and defense categories." Translation: On June 25, 2026, investors executed a disciplined portfolio realignment — exiting industrials for software and communications holdings while adopting a dollar-cost accumulation approach. The same day, two retail investors independently requested systematic diversification guidance using global equities, government bonds, and gold ETFs to insulate $150K and $1.5M wallets from turbulence. On June 15, Louis Navellier revised Stock Grader recommendations for 99 blue-chip stocks, triggering cascading adjustments across 17 client divisions that reduced asset redundancy by 14%.
- Oil-driven lift: WTI near $87 (vs. $112 in late May) reduces cost anxiety — but supply remains constrained. Only seven ships transited the Strait of Hormuz on Aug 20 versus 14 previously.
- Sector rotation executes: Capital moved out of industrials into digital-core holdings by late June — validated by Navellier's 99-stock revision and a 12% stability-index bump in three large caps.
- Adaptive caution: "Balanced allocation" is fund-manager code for "we have no idea what happens next," validated by retail investors seeking rigid allocation rules.
What the numbers actually say
| Index | Change | Level |
|---|---|---|
| Dow Jones | +0.62% | 53,083.12 |
| S&P 500 | +0.30% | 70,666.59 |
| Nasdaq | +0.05% | 26,080.54 |
| Nikkei | +0.05% | — |
| FTSE 100 | +0.44% | 20,010.90 |
The spread tells the story: the Dow outperformed the Nasdaq by roughly 12-to-1. On July 29, a reweighting exercise demonstrated why: price-weighted Dow gave Goldman Sachs, Caterpillar, and UnitedHealth a combined 25.94% weighting; under market-cap weighting, Apple, Nvidia, and Microsoft would command 49.7%. That is not a broad rally. That is money fleeing growth bets for whatever looks least flammable.
The portfolio strategy that dares not speak its name
The forecast: Short-term equity rebalancing continues through Q3 2026. Industry portfolio realignments executed in late June validate the call: the dollar-cost accumulation approach signals long-term wealth preservation — not cycle-chasing. On June 3, analysts warned that BND lacks shock absorption amid rising rates and equity sell-offs, recommending a shift to GOVT and tax-efficient municipal bond ETFs like VTEB. That same week, the S&P 500 dividend yield fell to 1.08%, the lowest since the 1800s — forcing retirees to blend REITs and covered-call strategies into income portfolios.
By mid-August, the VIX above 20 enabled covered-call ETFs like QQQI to generate 14% annualized income, turning volatility into yield. And on August 5, UWM posted a $451.9 million net loss driven by a $603.2 million derivatives loss tied to over-hedging a cancelled Two Harbors acquisition, sending shares down 34.78% to $1.20 in a single day — followed by a dividend suspension and a $2.05 billion emergency equity injection.
Investors remain "adaptively cautious," which is a polite way of saying they do not believe their own position sizes. The market is not climbing a wall of worry. It is shuffling sideways on a floor of doubt.
🚧 The Prediction-Market Crackdown: CFTC Plays King of the Hill, and Everyone Loses
The CFTC just nuked self-certification for prediction markets—clogging a pipeline that cleared 2,500 contracts since January without a single objection. That's like shutting down a highway because one driver sneezed. 🚧 CME's CEO says nobody ever opposed those filings. Now each one faces individual review. Listing density collapses. Liquidity evaporates. Spreads widen. Meanwhile, Kalshi's user engagement dropped 18% post-compliance, New York is suing for $36 B, and the AG is still demanding Kalshi operate there. Make it make sense. Traders lost $1 B+ in value. $500 M+ in potential taxes vanished into regulatory theater. The CFTC claims "commodity integrity"—what it delivered is a turf war where lawyers win and everyone else pays. Robinhood's CEO flagged insider trading on Polymarket and Kalshi. Now the CFTC is also policing how you're incentivized to trade, citing Kraken and Mexc. The watchlist just got longer, the rules got fuzzier. So here's the question for anyone holding a position or building on these platforms: Are you sticking around for the legal circus, or is this the offshore catalyst you've been waiting for?
What Happened
On July 22, CFTC Chair Michael Selig declared his agency the sole authority over prediction-market contracts. Eight states fired back with legal challenges—by late May, Minnesota, Rhode Island, and others already had bans in play. Minnesota's legislature passed its ban on May 19, signed by Governor Walz; the CFTC filed a federal preemption lawsuit the next day. Kalshi countersued on May 21. On July 28, a federal district judge blocked Minnesota's ban, citing "irreparable harm" under federal securities and futures regulations.
By July 26, the CFTC banned generic self-certification templates, warning that cookie-cutter certifications violate the Commodity Exchange Act unless accompanied by comprehensive analytical summaries. CME CEO Terry Duffy noted 2,500 self-certifications since January 2025—none opposed. Now that pipeline clogs.
On August 13, Selig ordered Kalshi to keep running in New York even as AG Letitia James sued to block its sports contracts, threatening $36 B in damages. Kalshi's post-compliance user engagement dropped an estimated 18%.
The Mechanics
Before this, platforms could self-certify contracts via CME Group's filing system without explicit CFTC sign-off. The new guidance kills that: each contract now faces individual review. Listing density across major exchanges is shrinking as compliance overhead rises.
On August 20, the CFTC Innovation Advisory Committee convened with over 30 industry leaders. Robinhood CEO Vlad Tenev flagged insider-trading incidents on Polymarket and Kalshi. Regulator Selig outlined a three-phase plan: define prohibited contracts, enhance reporting, tighten listing and consumer safeguards.
Why It's Ridiculous
The CFTC claims it's protecting "commodity integrity." What it's actually doing is creating a turf war that nobody wins.
Legal: Federal-state fragmentation guarantees months of court battles. The July 28 preliminary injunction temporarily blocks Minnesota's ban, but Minnesota filed a new suit on June 4 arguing constitutional overreach. New York's $36 B suit hangs over Kalshi. Kalshi hit $2 B annualized revenue in June and entered IPO talks at a $22 B valuation, but litigation timelines extend by quarters, not weeks.
Market operations: Self-certification was the grease. Removing it clogs the pipeline. Fewer contracts, less liquidity, higher spreads.
Trader impact: The American Gaming Association reported a $1 B loss in prediction markets. That's $44 B+ total market volume in 2025 diverting >$500 M in potential taxes—real money vaporized by regulatory theater.
New angle: On August 12, the CFTC issued guidance against "incentive programs" that reward high trading volume, warning they enable wash trading. Platforms such as Kraken and Mexc were cited. The regulator is now policing not just what you trade but how you're encouraged to trade it.
The Causal Chain
Late May: States ban prediction markets, CFTC sues Minnesota, Kalshi countersues → July 22: Selig asserts federal jurisdiction → July 26: CFTC bans generic forms → August 12: CFTC targets incentive programs → August 13: Selig orders Kalshi to stay in NY, James sues for $36 B → August 20: CFTC Innovation Advisory Committee meets, Tenev cites insider-trading cases.
What This Actually Means
- Volatility: Unverified term language introduces pricing chaos. Spreads widen. Execution quality drops.
- Consumer trust: Opaque futures terms erode confidence. Platforms lose users. Kalshi's IPO ambitions—$22 B valuation, talks with investment banks since June 19—face headwinds from litigation and a potential DOJ-FTC joint brief supporting federal lawsuits filed June 10.
- Sector impact: Derivative finance gets squeezed. Compliance overhead reduces operator discretion. The CFTC's June 10 proposed rule banning prediction markets tied to wars or assassinations adds another compliance layer.
Outlook
- Next 3 months: Courts adjudicate federal vs. state control. The July 28 injunction holds, but Minnesota's motion to dismiss the federal suit and the state's own June 4 lawsuit keep the fight alive. New York's $36 B suit hangs over Kalshi.
- 6 months: National betting ecosystem reshapes—or fractures entirely—depending on appellate outcomes. User engagement, down 18% post-compliance, may not recover.
- 12 months: Either Congress intervenes (unlikely) or the market migrates offshore (likely). Public trust declines as insider-trading cases mount.
The Bottom Line
The CFTC solved a problem that didn't exist and created three new ones. The only certainty: lawyers get paid. Traders, operators, and consumers absorb the cost.



Comments ()