Index records mask war-driven oil and rates stress
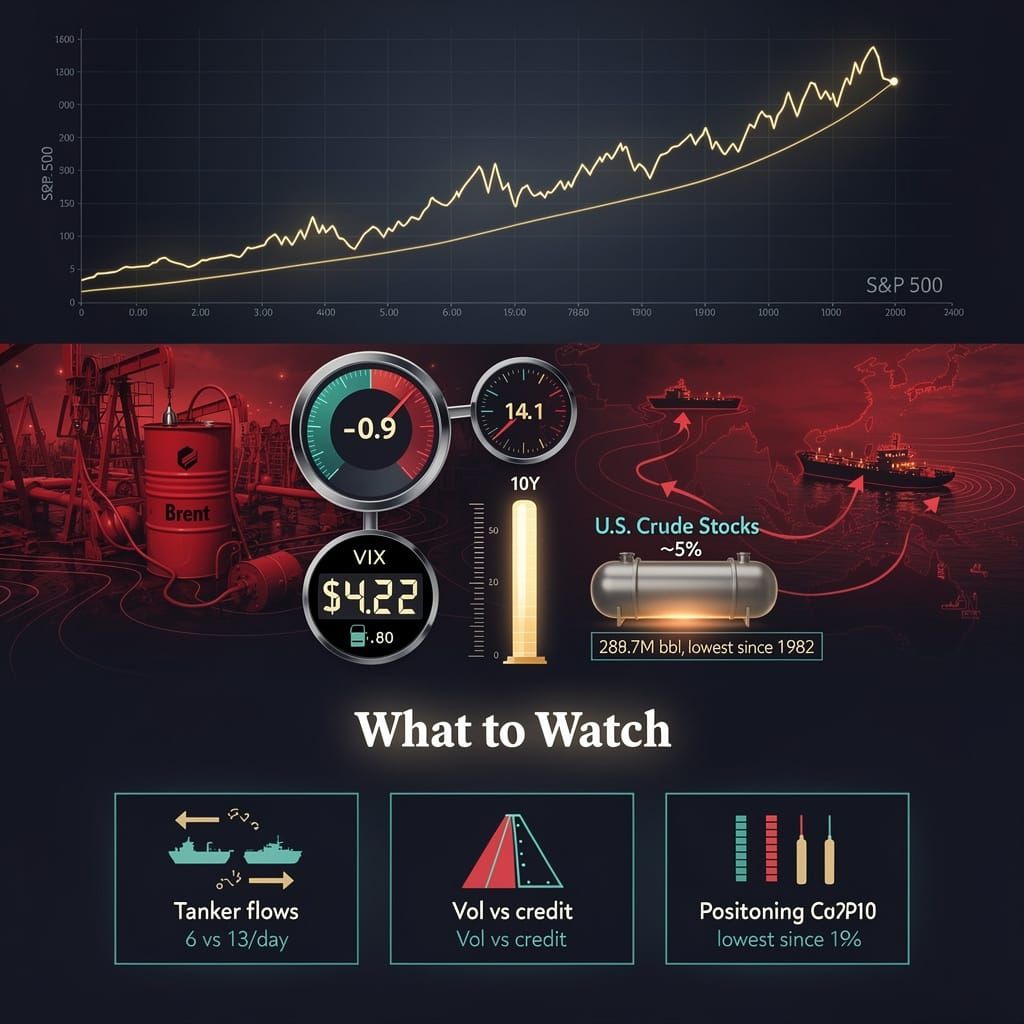
A record S&P 500 close on Sept. 28 while Goldman's equity positioning gauge hit −0.9, matching its March low. The calm is surface-level: single-stock vol looks cheap even as credit, energy, and rates price a rougher path. The mechanism: Iran-related supply disruption pushed Brent above $100 on Sept. 17, gasoline to $4.22, and 10-year yields near 5%—a three-year high. That keeps the short end of the curve elevated, raising the cost of capital for leveraged corporates and securitized structures, not headline indices. Notable: a single $6M trade bought deep in-the-money VIX puts before the Fed decision. Sophisticated money is hedging stress the index masks.
On September 28, Goldman Sachs's US equity positioning indicator dropped to minus 0.9, matching the low reached in March. The same day the S&P 500 printed a record close, and single-stock implied volatility traded at levels that look almost cheap by historical standards. The disconnect is not a data glitch. It is the signature of a market being carried upward by a narrow set of index constituents while the machinery underneath—credit, energy, and rate expectations—prices a markedly rougher path.
The oil-and-rates channel
The core mechanism is indirect but concrete. Iran-related supply disruption has kept Brent crude elevated relative to both the eurozone gas benchmark and the previous month's forward expectations. The escalation traces to early September, when Iran's IRGC launched ballistic missiles toward U.S. Navy warships on September 5 and U.S. Central Command struck back the next day, destroying three Iranian crude tankers—M/T Downy, M/T Stark 1, and M/T Kylo—near Kharg Island and the Gulf of Oman. Crude responded immediately: international Brent exceeded $100 per barrel on September 17, its first time above that level since July, adding more than 3% in a single session.
The transport constraint is measurable at the Strait of Hormuz, which moves a fifth of global oil and gas. Tanker traffic has fallen to roughly six vessels a day—half the 10-day average of 13—forcing Iraq, Kuwait, and the UAE to cut output. Iran's fleet damage and U.S. Treasury sanctions compound the pressure, and U.S. strategic stockpiles have slid to 289.7 million barrels, the lowest reading since 1982.
Elevated oil feeds directly into inflation expectations. Retail gasoline has run hot for weeks: it never previously exceeded $4 on Labor Day, then averaged $4.15 per gallon on September 4 (a record), with diesel peaking at $5.90. By the late-September escalation gasoline had reached $4.22 nationally, up 7 cents in one day. Central banks, still unwinding the tightening cycle, respond by keeping the short end of the yield curve high. That raises the cost of capital for issuers who refinance against floating-rate debt or short-dated paper—a burden that lands hardest on leveraged corporates and securitized fixed-income structures rather than on headline equity indices.
Goldman strategist Dominic Wilson reported on September 29 that oil remains the dominant factor shaping rates, persisting despite corporate efforts to adjust. Kamakshya Trivedi separately flagged that the firm's macro lens views energy as the binding constraint on how far any yield normalization can proceed. Treasury data underscore the stickiness—10-year yields have pressed near 5%, a three-year high, even as the Treasury Department expanded its buyback program in late August to $4 billion from $2 billion to add liquidity to the 10-to-30-year segment.
Breadth tells a different story than the headline
The S&P 500's record close masks what the underlying data show. Goldman's positioning metric at minus 0.9 mirrors a past spring bottom, and margin debt has continued to accumulate among speculators even as breadth narrows. The equity volatility surface remains unusually relaxed: the Cboe VIX touched 14.1 in August, its lowest reading of the year, even as tech volatility reversed from record highs and the VIXEQ-to-VIX spread widened to historic levels.
Yet the option market is showing strain beneath that calm. On September 16, with the VIX holding above 16 and the gap between the VIX index and futures near its widest since June, a single $6 million trade bought deep in-the-money VIX puts—563 contracts at the 110-strike expiring October 21 for $5.1 million, plus $1.2 million of 130-strike puts expiring November 18—betting on a decline before the Fed's rate decision. That unusual conviction, plus a $630,000 VIX long opened in mid-August, signals sophisticated money positioning around volatility outcomes even as the headline index sits at records. Bond and credit markets already price materially higher stress than equity vol suggests. When equity implied vol sits below where credit spreads and 10-year yields indicate, hedges are cheap but thin, leaving the system exposed to abrupt directional moves triggered from outside the equity complex.
There is an unresolved counter-signal. Citadel Securities' Scott Rubner has flagged that compressed single-stock volatility made downside protection the cheapest of the year precisely as macro events loom. Goldman's positioning team likewise describes investors as behaving as though drawdowns are imminent despite calm surface readings. That underweight posture itself creates upside risk: every rally forces participants to choose between active participation and passive observation.
What to watch
Three indicators are tied directly to this thesis and observable in the weeks ahead:
- The Brent-to-European-gas differential and Hormuz transit counts: whether tanker flows recover toward their 13-vessel average and crude compresses back below $100, or whether the supply constraint persists and keeps transmission pressure on rates.
- The equity-implied-vol versus rate/credit gap: whether single-stock and index vol converge toward the stress already embedded in 5% ten-year yields and credit spreads, or widen further, confirming the current hedging imbalance persists.
- Goldman's US equity positioning reading and the VIX-futures basis: whether positioning recovers from minus 0.9 or deepens with fresh outflows, and whether the index-versus-futures gap normalizes after the mid-September anomalies.
This is reporting and analysis of market structure, not a recommendation. The mechanism is concrete: war-driven supply disruption has pushed crude and gasoline to levels that keep the short end of the yield curve high, rates raise the cost of capital, and a narrow set of index constituents continues to mask broader stress that the option and credit markets are already pricing.
Comments ()