Waymo Uber Tesla Drive AI Growth Amid Legislation Earnings and Safety Wins
TL;DR
- Waymo's 2025 on‑ramp incidents spark San Francisco driverless vehicle legislation
- Uber's Q3 earnings reveal 21% rise in cash generation thanks to autonomous ride‑sharing growth
- Tesla FSD hardware 3 successfully averts crash, prompting focus on AI safety protocols
- Waymo rollout to Phoenix and San Francisco indicated level 4 autonomous taxis enter pilot
- Uber integrates generative AI across productivity, signaling shift toward autonomous vehicle data annotation
- Tesla's semi production delay shifts industry focus toward autonomous cargo trucks
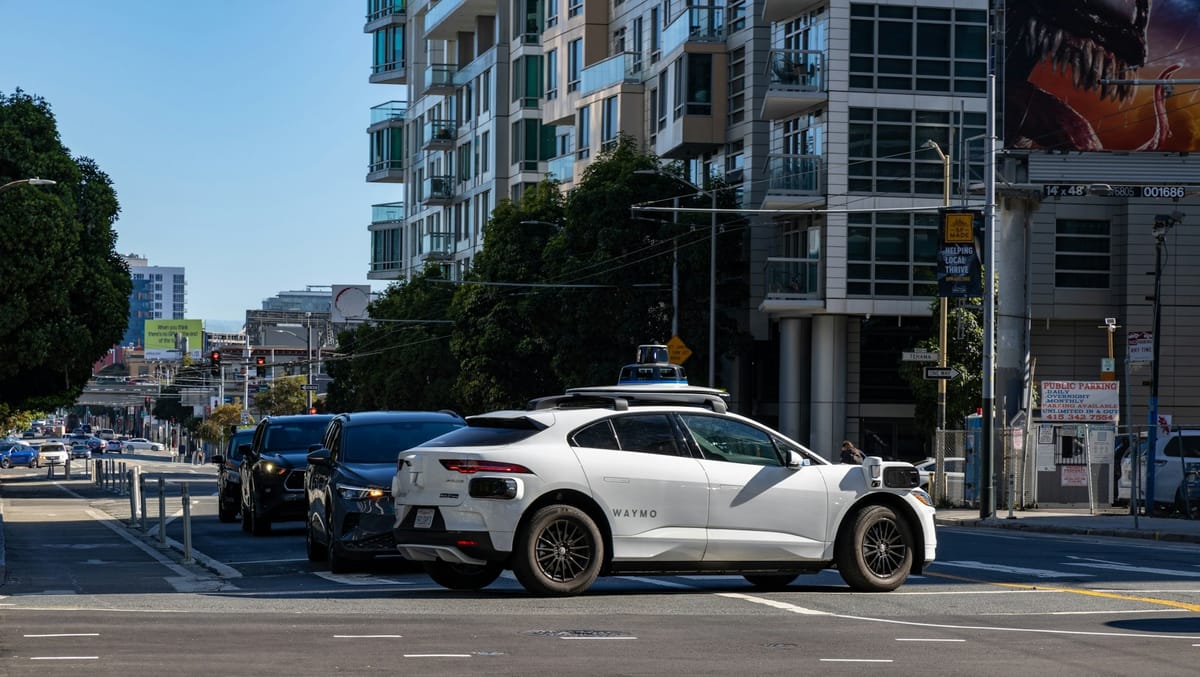
Waymo’s 2025 San Francisco Incidents Prompt a Legislative Reckoning
Incident Surge
- 16 Oct 2025 – “Riley Walz” jam: roughly 50 Waymo taxis blocked a downtown corridor for up to 12 minutes; no injuries.
- 27 Oct 2025 – Waymo vehicle struck the “KitKat” mascot; animal fatality confirmed, eyewitness accounts dispute timing.
- 29 Oct 2025 – TikTok video shows a Waymo taxi running a red light; 5 M+ views, no crash recorded.
- 4 Nov 2025 – Multiple stalled Waymo vehicles created intersection bottlenecks; passenger support tickets surged.
Safety Trends
- Autonomous‑vehicle miles in the Bay Area rose to an estimated 57 M in 2025 (up from 30 M in 2022).
- Pedestrian fatalities in San Francisco reached ≥10 in 2025, a modest rise from 6 yr⁻¹ in 2022.
- Animal‑collision reports climbed to 1.3 k in 2025, driven largely by high‑profile cases.
- Waymo‑related traffic‑disruption incidents increased from <5 yr⁻¹ (2022) to 12 yr⁻¹ in Oct–Nov 2025.
The data show a clear correlation between deployment density and non‑injurious disruptions, while isolated animal collisions command outsized media attention.
Legislative Pushback
- Supervisor Jackie Fielder introduced a voter‑referendum model for precinct‑level autonomous‑vehicle approvals.
- SB 915 (2024) was withdrawn after the Assembly Transportation Committee cited licensing complexity.
- SFMTA reports a $300 M budget gap, heightening pressure to monetize autonomous‑vehicle operations.
- Governor Gavin Newsom vetoed two Teamster‑backed safety bills, leaving a regulatory vacuum.
Expansion vs. Safety
- 2026 rollout plans target San Diego, Las Vegas, Detroit, and London, yet no public safety thresholds have been disclosed.
- The core San Francisco market continues to experience rising incident rates, fueling the referendum movement.
- State‑level permits and winter‑testing certifications are pending for several new markets.
Outlook (2026‑2027)
- Projected traffic‑disruption incidents: ≤ 0.02 per 1 M Waymo miles after software updates.
- Waymo‑attributable pedestrian fatalities expected to remain ≤ 1 % of total deaths.
- One to two California jurisdictions may adopt the voter‑referendum model by mid‑2026.
- Detroit, Las Vegas and San Diego launches are slated for Q2‑Q3 2026, contingent on regulatory clearance.
Recommendations
- Waymo: Prioritize over‑the‑air patches for stall detection and automated rerouting; deploy a real‑time incident dashboard for city traffic centers.
- City Regulators: Mandate monthly safety metrics (incident rate per 1 M miles, response latency) as a condition of continued operation.
- Legislators: Anchor voter‑referendum thresholds to quantitative safety benchmarks to balance community control with operational feasibility.
Uber’s Cash Surge: How Autonomous Ride‑Sharing Is Fueling a New Growth Engine
Revenue and cash‑flow breakout
- Q3 2025 revenue = US$13.73 B (+20 % YoY), narrowly missing consensus by US$70 M.
- Free cash flow = US$2.23 B, a 21 % YoY increase that lifts the trailing‑12‑month cash‑generation run‑rate to roughly US$9 B.
- Adjusted EBITDA reported in a US$2.41‑2.51 B range, reflecting a 33 % YoY gain.
- Gross bookings reached US$49.74 B (+21 % YoY) and total trips rose to 3.5 B (+22 % YoY).
Autonomous ride‑sharing as a catalyst
- AV‑related capital continues to flow into autonomous‑vehicle technology and OEM partnerships, notably with Nvidia and Stellantis.
- Generative‑AI tools are embedded in the autonomous‑driving stack, enhancing video annotation and data‑collection pipelines.
- U.S. trip growth exceeds 21 % and is partially attributed to early AV pilot deployments, indicating an emerging revenue source.
- The autonomous mobility market is projected to reach US$307 B by 2033, representing a CAGR of ~27.5 %.
Drivers of cash generation
- Booking volume surge (+21 % YoY) lifted transaction fees and platform‑service margins.
- Higher trip frequency (+22 % YoY) increased revenue per active user, improving cash conversion.
- AI‑enabled fleet optimization reduced per‑trip costs, directly boosting operating cash flow.
- Delivery segment growth added US$4.48 B in revenue and reinforced cross‑selling opportunities with ride‑share users.
Emerging trends and risks
- AI‑centric AV development is accelerating, with high‑performance compute partnerships central to scaling.
- Multi‑service users spend roughly three times more than single‑product users, strengthening network effects.
- Regulatory exposure includes a US DOJ lawsuit (US$125 M) that may generate short‑term cash outflows but does not alter the overall cash‑generation trajectory.
- Geographic diversification shows consistent booking momentum across the U.S., Europe, and APAC, mitigating regional concentration risk.
Outlook and strategic focus
- FY 2025 gross bookings are projected at US$52.3‑53.8 B, implying 31‑36 % YoY growth.
- Adjusted EBITDA is expected to center around US$2.5 B, maintaining roughly 4.5 % of bookings.
- Free cash flow guidance of US$2.5‑2.7 B suggests continued >20 % YoY cash‑flow growth.
- Prioritizing AV pilot scale‑up, deepening AI‑driven fleet optimization, and maintaining a litigation contingency are essential to sustain cash‑flow acceleration and capture a larger share of the autonomous mobility market.
Tesla’s HW3 FSD Shows Measurable Crash‑Avoidance and Drives AI‑Safety Standards
Real‑World Avoidance Event
On 4 Nov 2025 a Tesla equipped with Full‑Self‑Driving (FSD) on Hardware 3 detected a box truck that cut into its lane at 45 mph. The system performed a blind‑spot check, executed a lateral maneuver, and avoided hard braking—all without driver input. The telemetry logged the incident as a protective event, confirming that HW3 can react faster than a typical human driver in high‑risk cut‑in scenarios.
Safety Metrics Reveal a Ten‑Fold Advantage
- Overall Autopilot/FSD crash rate: 1 crash per 6.99 M miles (Tesla telemetry).
- HW3‑specific crash rate (Q2 2025): 1 crash per 6.29 M miles.
- U.S. average across all vehicles: ~1 crash per 700 k miles (NHTSA).
- Resulting ratio: HW3 crash frequency ≈10 × lower than the national average.
- Sensor suite: eight cameras plus additional sensors deliver comprehensive perception.
- Autopilot mileage logged in Q2 2025: 6.69 M miles.
These figures place HW3 among the safest autonomous stacks currently deployed, providing a data‑driven benchmark for industry safety baselines.
Software Updates Prioritize Safety
- FSD v14 (03 Nov 2025): All‑wheel steering calibration, enhanced cut‑in handling, school‑bus logic—expands decision horizon and reduces false‑positive braking.
- FSD v14 Lite (mid‑2026 rollout): Dedicated safety‑protocol package for HW3 and HW4, adding protective‑mode thresholds and tighter sensor‑fusion validation.
- Mad Max mode investigation (04 Nov 2025): NHTSA inquiry prompts mandatory safety‑override logic across all FSD releases.
The progression from performance‑centric releases to safety‑centric bundles signals a strategic shift toward formal AI‑safety engineering.
Regulatory Alignment Accelerates Protocol Hardening
NHTSA’s investigations—targeting high‑speed autonomous operation, door‑handle failures, and cut‑in scenarios—use Tesla’s sub‑million‑mile crash data as a risk‑assessment reference. This alignment encourages pre‑emptive firmware patches that embed protective overrides, ensuring compliance while preserving HW3’s operational viability.
Emerging Trends and Outlook
- HW3 remains functional in newer models, delivering measurable safety outcomes without immediate retrofits.
- Subscription‑based FSD (≈60 % usage among premium owners) expands the data pool for continuous safety analytics.
- Within 12 months, mandatory safety‑override patches for HW3 are expected, driven by NHTSA findings.
- In 2–3 years, a standardized AI‑Safety API may enable third‑party verification of autonomous decision logs.
- Long‑term phase‑out of HW3 will anchor future hardware (HW4) to the crash‑rate baseline set by HW3, shaping industry‑wide safety thresholds.
The November 4th incident, coupled with consistent crash‑rate advantages and proactive software safeguards, positions Tesla’s HW3 FSD as a practical exemplar of AI‑safety integration. Continued regulatory scrutiny and data‑rich deployments are likely to cement safety‑first protocols as a de‑facto standard for autonomous vehicle systems.
Waymo’s Level‑4 Robotaxi Pilot Signals a Blueprint for Nationwide Autonomous Mobility
Operational Foundations
- Active commercial fleets operate in Phoenix and the San Francisco Bay Area, deploying Jaguar I‑Pace SUVs alongside Zeekr‑RT prototypes.
- Cumulative autonomous mileage exceeds 100 million miles nationwide; Phoenix accounts for roughly 40 million, San Francisco for 60 million.
- Paid rides surpass 10 million across both markets, translating to an average weekly capacity of about 250 000 trips.
Regulatory Leverage
- California’s statewide commercial autonomous‑ride‑hailing license, secured in 2024, eliminates the need for city‑by‑city permits and accelerates deployment.
- Arizona’s municipal permits granted to Phoenix in early 2024 provide a complementary, localized framework.
- Emerging state‑wide licensing trends suggest Nevada and Texas may follow California’s model by mid‑2026, smoothing the path for expansion.
Technical Convergence
- A unified hardware platform—Jaguar and Zeekr vehicles—reduces integration complexity and supports over‑the‑air updates for Waymo’s 6th‑generation driver software.
- Winter testing in Detroit validates operation under snow and ice, confirming climate‑robustness across the U.S. weather envelope.
- Incident logs show an operational disruption rate of 0.2 % of trips, comfortably below the industry threshold of 0.5 % for major events.
Strategic Growth Patterns
- Geographic concentration remains within three core markets—Phoenix, San Francisco, Los Angeles—forming a coastal‑to‑mid‑continent corridor that leverages existing regulatory familiarity.
- Projected addition of 2–3 service zones in San Francisco (South‑SF, Mission District) will raise weekly rides to approximately 300 000 across both pilot cities.
- Fleet augmentation of roughly 150 vehicles supports the projected ride‑volume increase while maintaining the current incident rate.
- Waymo’s cumulative miles and regulatory approvals outpace competitors such as Zoox and Cruise, reinforcing its market leadership.
Economic Outlook
- Estimated revenue contribution to Alphabet’s “Other Bets” segment rises by $120 million over the next twelve months, based on an average of $12 per ride.
- Continued state‑wide licensing adoption could unlock at least two additional U.S. markets, expanding the addressable revenue base substantially.
- Stable public sentiment—characterized by optimism and minimal backlash—underscores a favorable environment for scaling autonomous services.
Key Takeaway
The convergence of state‑wide licensing, a standardized vehicle fleet, and climate‑proven autonomous technology positions Waymo’s Level‑4 pilot as a replicable model for national rollout. Monitoring permit pipelines, incident dashboards, and ride‑growth metrics will be crucial to confirming the projected trajectory and sustaining the competitive edge in the emerging autonomous mobility landscape.
Uber’s AI Gambit: From Ride‑Share to Autonomous Data Engine
Unified AI Strategy
Uber’s Q3 2025 earnings call linked two distinct initiatives—enterprise‑wide generative‑AI tools and autonomous‑vehicle (AV) data pipelines—into a single roadmap. Adjusted EBITDA rose 33 % YoY, delivering $9 bn of cash in the trailing twelve months, while the company highlighted a projected AV market of $307 bn by 2033 (27.5 % CAGR). This financial strength underwrites the dual push for internal productivity and external data services.
- Adjusted EBITDA + 33 % YoY
- Cash generation ≈ $9 bn (TTM)
- AV market forecast: $307 bn by 2033, 27.5 % CAGR
Gig‑Powered Annotation
The “Digital Tasks” pilot launches a gig‑economy platform for AI‑training data, initially in the United States and India. By recruiting low‑cost, high‑volume contributors, Uber can annotate the video and sensor streams required for AV perception models. Early feedback shows 80 % of participating dealers report improved customer retention, suggesting a scalable demand curve.
- Pilot regions: US & India
- Target: 1 M active gig contributors within 12 months
- Projected revenue lift from annotation services: ≥15 % YoY
GPU Partnerships Accelerate Model Training
Strategic ties with NVIDIA—mirrored in Stellantis‑Uber collaborations—provide dedicated GPU clusters for multimodal model training (video, LiDAR, radar). This hardware focus is expected to compress model development cycles and boost perception accuracy.
- GPU allocation enables ≥25 % faster training runs
- Anticipated mean‑average‑precision (mAP) gain: +5 pp over 2024 baselines
- Supports vision‑language models tailored to AV sensor fusion
Financial Leverage for Long‑Term AI
The record $2 bn gross bookings over Halloween weekend and an EBITDA margin of 4.5 % of gross bookings demonstrate Uber’s ability to fund sustained AI R&D. Capital earmarked for NVIDIA partnerships and the Digital Tasks infrastructure illustrates a deliberate allocation toward data acquisition and model refinement.
Projected Market Position
If the annotation platform reaches its contributor target, Uber could become one of the top three providers of AV training datasets by 2027, complementing its ride‑share operations with a data‑service revenue stream. The convergence of cash flow, hardware acceleration, and crowdsourced labeling positions Uber to influence both the AV ecosystem and the broader AI‑driven mobility market.
- Nov 3 2025: Stellantis‑Uber‑NVIDIA partnership announced
- Nov 4 2025 (morning): Q3 earnings call reveals AI integration roadmap
- Nov 4 2025 (afternoon): Digital Tasks pilot goes live in US & India
Tesla’s Semi Delay Accelerates the Rise of Autonomous Freight Trucks
Market realignment triggered by the postponement
- Original launch target: 2019–2021 → first limited‑run now scheduled for Q1 2026, volume production H2 2026
- Price point: US $180 k for the 500‑mile range model
- Measured safety of Tesla’s HW3 platform: 1 crash per 6.69 M mi (Q2 2025)
- Charging readiness: underground depot chargers (Proviridis + Kempower) deployed in Nevada and California pilot sites
These data points reveal a four‑year gap between the announced and actual delivery dates, opening a clear capacity void for fleets that had budgeted for early 2020s adoption.
Competitors step into the breach
- Aurora Innovation runs driverless routes across Texas, reporting US $1 M quarterly revenue while expanding to Phoenix; partnership with McLeod Software provides a dedicated TMS for autonomous fleets.
- General Motors plans an “eyes‑off, hands‑free” system for 2028, signaling long‑term commitment to autonomous freight.
- Stellantis, Mercedes‑Benz, and Nvidia collaborate on Level‑4‑ready trucks; Volkswagen targets an ID. Buzz launch in Los Angeles (2026).
- European startups retrofit diesel rigs with electric drivetrains, aligning with regional emission mandates.
Infrastructure and regulatory momentum
- Underground depot chargers are being installed at key pilot locations, satisfying a prerequisite for large‑scale electric haulage.
- State‑level zero‑tailpipe mandates in California and Nevada incentivize early adoption of autonomous electric trucks.
- The autonomous‑vehicle market, valued at US $34.6 B in 2024, is projected to reach US $307 B by 2033 (CAGR 27.5 %). Freight accounts for the fastest growth segment.
Forecast for autonomous cargo capacity
- By mid‑2027, autonomous cargo‑truck capacity is expected to exceed 10 % of total U.S. freight tonnage, driven primarily by non‑Tesla providers filling the interim gap.
- Total cost of ownership calculations remain favorable for electric trucks despite the US $180 k price point, owing to fuel savings and carbon‑credit incentives.
- Tesla’s forthcoming FSD v14 Lite for trucks (HW3) will likely enter commercial validation after volume production commences in late 2026.
Strategic implications
- Logistics operators should prioritize partnerships with autonomous‑ready vendors to mitigate the short‑term capacity shortfall.


Comments ()