Fed Holds Rates Amid Stubborn Inflation: Borrowers Pinched
TL;DR
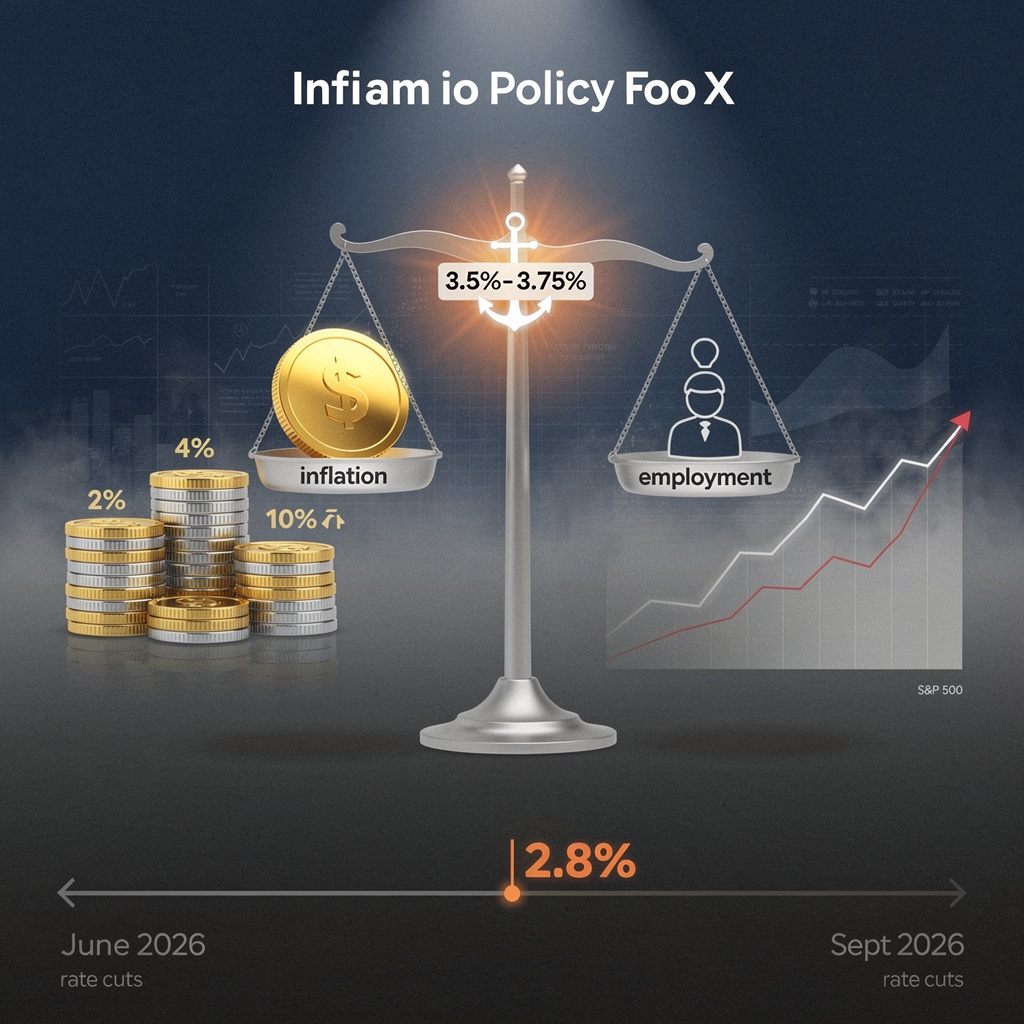
- Federal Reserve Holds Rates at 3.5%-3.75% as Inflation Remains Above 2% Target
- U.S. Beef Market Consolidation Reaches 80% Control by Four Major Packagers
- Figma Reports 40% Revenue Growth, Shares Surge 15% After Hours
📈 Fed Holds at 3.5 %–3.75 %: 10-2 Vote as Core Inflation Stays Elevated
The Fed holds rates at 3.5 %–3.75 % with a 10-2 vote, as core inflation stubbornly sits at 2.8 %—above the 2% target for 3+ months. That's like adding another 0.8% to every dollar you spend. Despite political pressure and legal probes, the committee prioritizes data over drama. Who feels the pinch? Every borrower and business planning for 2026. — With two dissenters pushing for cuts, is the Fed being too cautious with your wallet? 🤔
The Federal Open Market Committee voted 10-2 this week to hold the federal funds rate steady at 3.5%–3.75%, a decision that underscores a central truth: the battle against inflation is not yet won. With core PCE inflation still at 2.8%—well above the Fed’s 2% target—and a labor market showing signs of stabilization, policymakers signaled a patient, data-dependent stance. Markets have largely priced in this restraint, but the path forward hinges on a single, stubborn metric: the persistent rise in service-sector prices.
The Mechanics of Restraint
The decision was a classic display of the Fed’s dual-mandate calculus. While the cooler January CPI reading of 2.4% offered a glimmer of progress, officials zeroed in on the core PCE figure of 2.8% as the more telling indicator. This measure strips out volatile food and energy prices, revealing that underlying, service-driven inflation remains entrenched. Simultaneously, an unemployment rate holding at 4.4% and weekly jobless claims near 200,000 provided the cover to maintain pressure without jeopardizing employment. The two dissenting votes, from Governors Stephen Miran and Christopher Waller, advocated for a cut, highlighting an internal debate over the risks of overtightening.
The Impacts: A Market in Waiting
The immediate fallout from the hold is a market in stasis, parsing every data point for clues on the pivot.
- Financial Markets: Equity indices reacted with muted uncertainty—the S&P 500 inched up a single point while the Dow dipped slightly. More telling was the surge in haven assets: gold rose 4% and silver jumped over 10%, signaling persistent risk-off sentiment despite the status quo.
- Forward Pricing: Market-implied probabilities, as tracked by the CME FedWatch tool, now assign a 90% chance of another hold at the March meeting. This reflects a consensus that the Fed will require more than one month of improved data before altering course.
- Political & Institutional Pressure: External noise is rising. Public calls from the executive branch for more aggressive cuts, coupled with legal probes into Chair Powell, inject governance uncertainty. However, the 10-2 vote demonstrates that, for now, operational independence remains intact.
The Path Ahead: Conditional and Gradual
The Fed’s forward guidance paints a picture of cautious, conditional easing, entirely dependent on incoming data.
- Q2–Q3 2026: Market surveys, like the CNBC Fed Survey, project the most likely window for initial cuts. Two quarter-point reductions are tentatively forecast for June and September, but only if core inflation trends convincingly toward 2% and the labor market shows clear signs of easing.
- Q4 2026–2027: This horizon holds divergent risks. Should core services inflation stall at or above 2.8%, the discussion could swiftly revert to potential rate hikes. Conversely, if inflation recedes as projected, the Fed envisions a gradual normalization, with the target range potentially drifting to 3.0%–3.25% by 2027.
A Calculated Hold for an Unfinished Task
The Fed’s decision is less about inaction and more about strategic patience. By holding firm, officials are betting that sustained restraint will finally tame service-sector inflation without triggering a recession. The two dissenting votes serve as a reminder that the cost of this patience—potentially slower growth—is a real trade-off. For markets, businesses, and consumers, the message is clear: the era of ultra-low rates is over, and the path to a new normal will be slow, data-driven, and fraught with political crosscurrents. The true test of this policy will come not in the quiet of a meeting room, but in the monthly prints of the core PCE report.
📈 U.S. Beef Market: 80% Controlled by Four Packers as Consumer Prices Double and Producer Margins Collapse
Four firms control >80% of U.S. beef processing—a level of concentration not seen since the 'Big Five' era a century ago. 🥩 Consumer steak prices have doubled since 2020 (+$3/lb), while farm-to-wholesale margins collapsed 67%. Despite this, packer profits are negative, showing cost pass-through without efficiency gains. A single plant outage can spike prices 4% instantly. Are you feeling the pinch at the grocery store?
Four companies now slaughter and pack more than 80% of America’s beef. This unprecedented concentration—Cargill, Tyson Foods, JBS USA, and National Beef—has become the defining feature of the market, raising urgent antitrust alarms. The recent withdrawal of a USDA rule aimed at curbing “unfair practices” in livestock markets, aligning with the Trump administration’s deregulatory push, has intensified the debate. Critics argue this consolidation is inflating grocery bills and squeezing ranchers, creating a system where a handful of firms hold disproportionate power over what ends up on our plates and what producers earn for their cattle.
How the Market Tightened
The path to 80% control is a story of decades‑long integration. Following Reagan‑era deregulation in the 1980s, which permitted major mergers, packers steadily expanded their control through contracts that bind every step from breeding to slaughter. This vertical integration systematically reduced options for independent producers. While the Packers and Stockyards Act (PSA) of 1921 was designed to prevent such power imbalances, its enforcement has waned. A 2021 congressional revision sought to reinforce fairness, but the core dynamics remained unchanged, allowing the “Big Four” to cement their dominance.
The Tangible Impacts of Consolidation
The economic consequences are stark and measurable, affecting both consumers and producers:
- Consumer Costs: The average price for steak has surged by $3 per pound since December 2020, reaching $5.44 by the end of 2025. The wholesale price for ground beef jumped 16% in 2025 alone, with the overall beef component of the Consumer Price Index rising approximately 15.5% year‑over‑year as of January 2026.
- Producer Squeeze: The farm‑to‑wholesale price spread—a key indicator of rancher profitability—collapsed from $0.89 per pound in December 2020 to just $0.29 per pound by December 2025. The farm‑gate value per carcass fell 27% over the same period.
- Market Rigidity: Processing capacity utilization exceeds 95% at the dominant plants, while smaller regional packers operate below 60%, illustrating the locked‑in nature of supply.
Institutional Response & Critical Gaps
Recent months have seen a flurry of conflicting policy moves, creating a complex enforcement landscape:
- Enforcement Pressure: In January 2026, the Department of Justice, directed by the Trump administration, launched an antitrust investigation into the “Big Four,” focusing on price‑setting and market allocation.
- Regulatory Rollback: On February 19, 2026, the USDA withdrew a proposed rule that would have mandated transparent contract terms and banned coercive pricing—a move critics see as a major setback for market fairness.
- Market‑Based Lever: An executive order in early February expanded tariff‑rate quotas for Argentine beef imports by 80,000 tonnes annually, a supply‑side attempt to exert downward pressure on prices. However, this volume represents less than 5% of total U.S. consumption, limiting its near‑term impact.
A critical gap persists: while packers face negative profit margins, consumer prices continue to climb. This divergence suggests cost increases are being passed through without corresponding efficiency gains, a symptom of a non‑competitive market where few players can dictate terms.
The Outlook: Scrutiny Without Structural Change
- 2026–2027: Expect heightened antitrust scrutiny and potential civil penalties, but only modest market impact. The Argentine import quota may dampen wholesale price growth by roughly 0.5% year‑over‑year. Price volatility is likely to increase slightly.
- 2028–2030: Without decisive legislative action to strengthen the PSA, market concentration will likely persist above 75%. Antitrust cases may force some contract disclosures, improving transparency but failing to meaningfully fragment market share or lower barriers to entry, which require over $2 billion per new plant.
- 2031 & Beyond: Structural reforms—such as mandating third‑party contract audits and enhancing the USDA’s real‑time market monitoring—are necessary to foster competition. Absent these, consumer beef prices are projected to remain elevated, rising 4–5% above general inflation annually, while producer profitability stays constrained.
The U.S. beef sector stands at a crossroads, defined by historic consolidation, regulatory ambiguity, and clear economic strain on both ends of the supply chain. The four‑firm grip is not merely a statistic; it is a market structure with direct consequences for affordability and equity. Restoring functional competition will require moving beyond cyclical investigations and toward transparent, enforceable rules that open the market to new entrants and fairer bargaining.
⚡ Figma's 40% Revenue Surge Sparks 15% Rally Amid Deepening Losses
$303.8M Q4 revenue (+40% YoY) SHATTERED expectations, yet a net loss of $226.6M looms. That's like adding a city's worth of users (70% spike!) but burning cash on AI labs. Gross margin at 86% shows pricing power, but investors are tired of the 'growth over profits' playbook. Can Figma's 136% customer retention finally turn AI hype into sustainable profit?
Figma’s fourth-quarter results delivered a clear message: aggressive investment in artificial intelligence is fueling user growth and revenue, but profitability remains a distant target. The design-software giant reported revenue of $303.8 million, a 40% year-over-year jump that surpassed analyst expectations. The beat, coupled with a 70% quarterly surge in weekly active users following major AI feature launches, sent shares soaring 15% in after-hours trading.
How AI Drove the Numbers
The company’s growth engine is its deepening AI integration. New tools like a Claude Code importer and support for Google’s Gemini 3 Pro were rolled out in the quarter, directly correlating with the dramatic spike in user engagement. This product-led growth is further amplified by stellar customer loyalty; net dollar retention hit a record 136%, indicating existing clients are spending significantly more. However, this growth comes at a cost. The company posted a net loss of $226.6 million, with margins pressured by heavy AI research spending and its recent $200 million acquisition of collaboration-platform Weavy Inc.
Impacts: Growth vs. Gaps
The quarterly report reveals a company executing on expansion but struggling to convert that momentum into profits.
- Financial Performance: 40% revenue growth and 86% gross margin → demonstrates strong pricing power and market demand.
- Profitability & Investment: net loss of $226.6 million and gross margin decline from 92% to 86% → reflects the substantial cost of AI R&D and acquisitions.
- User & Market Position: weekly active users +70% and 95% of Fortune 500 as clients → cements enterprise dominance and validates AI product strategy.
- Valuation & Risk: forward P/E ratio of ~91x and 12-month share decline of ~35% prior to rally → indicates persistent investor skepticism about the path to profits.
The Road Ahead
Management’s guidance projects this momentum will continue, forecasting fiscal 2026 revenue of approximately $2.37 billion. The immediate focus will be on the upcoming first quarter, where revenue is targeted between $315 million and $317 million. The strategic playbook is clear: monetize the newly engaged user base.
Short- and Mid-Term Outlook
- Q1 2026: Revenue expected to hit ~$317M (+38% QoQ), with net loss narrowing slightly as AI-driven upsell revenue begins to offset high R&D costs.
- 2026–2027: Full-year revenue target of $2.37B implies a ~7.8x annualized growth rate from Q4. Key milestones will be the restoration of gross margins above 90% post-Weavy integration and the introduction of tiered pricing for premium AI features.
- Long-Term (12–24 months): Breakeven hinges on improving free-cash-flow margins by at least 10 percentage points. Success depends on maintaining AI differentiation against competitors like Anthropic and Google’s Gemini ecosystem to protect its premium pricing and high retention rates.
The 15% after-hours pop is a reward for growth exceeding expectations. Yet, for a stock still down over 80% from its IPO peak, the rally underscores a market that remains highly sensitive to top-line performance while continuing to discount persistent losses. Figma has proven it can win users with AI. The next quarter will test whether it can start turning those users into profits.
In Other News
- U.S. New Vehicle Prices Hit Record $49,191 as Loan Terms Stretch to 68.8 Months
- WEC Energy Group Raises 2026 Guidance, Price Target Lifted to $120
- Goldman Sachs Lifts Duke Energy Target to $142 as Infrastructure Demand Grows


Comments ()