10-Yr Yields & 2s10s Invert to 1980s Lows—U.S. Households Face $1K+ Tariff Burden: Recession Risks Grow
TL;DR
- 10-Year Treasury Yields Rise to 4.18% as Fed Maintains Hawkish Stance
- U.S. Tariffs Imposed on Consumers Cost Households $1,000 in 2025, $1,300 Expected in 2026
🚨 10-Year Yields Hit 4.18%, 2s10s Invert to -190 bps: U.S. Treasury Markets Signal Recession Risks From Fed Hawkishness
10-year yields hit 4.18% and the 2s10s spread inverted to a stunning -190 bps—the deepest since the 1980s-90s, a recession red flag 🚨 Historical models say this could mean a downturn in 12-18 months, yet the Fed just picked a hawk (Warsh) who won’t cut rates. Fighting inflation with high rates, but is that risking a recession? Institutional investors, corporations, and your variable-rate mortgage — How would a near-term recession hit YOUR wallet?
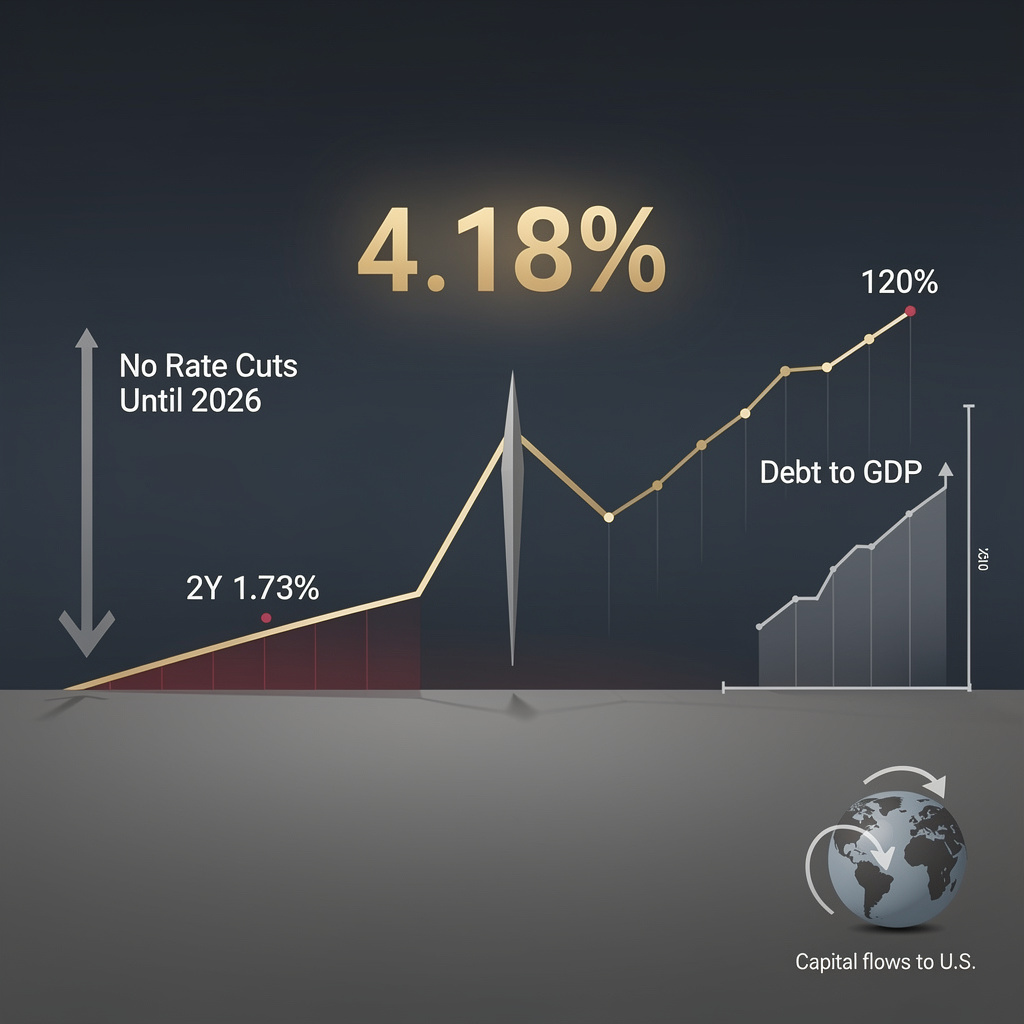
The U.S. Treasury’s $54 billion sale of 10-year notes on February 15—priced at a yield of 4.18%—isn’t just a routine auction result. It’s a milestone in a broader battle: the Federal Reserve’s unyielding fight against inflation, reflected in elevated rates, a deeply inverted yield curve, and mounting recession signals. As the Fed reinforces its “no rate cuts anytime soon” stance (via Chair nominee Kevin Warsh and Governor Jerome Powell), markets are grappling with a new normal: high yields, persistent inversion, and uncertainty about when— or if—calmer waters will return.
How Did We Get Here? The Mechanics of Elevated Yields
The 4.18% yield on 10-year notes isn’t random. It’s the product of three interlocking forces:
First, record issuance meets steady demand. The Treasury flooded the market with $766 billion in short-term bills and notes in a single week (February 1) and $54 billion in 10-year notes—yet institutional investors still bought in, avoiding a yield spike. That signals a rare appetite for long-duration assets even as the yield curve inverted: the 2-year Treasury yield (1.73% as of May 24) now sits 190 basis points below the 10-year rate—the deepest inversion since the 1980s-90s.
Second, Fed policy is stuck in “hawkish purgatory”. Warsh’s nomination (a known inflation hawk) and Powell’s repeated refusal to rule out more rate hikes have frozen market expectations: cuts are not imminent. Meanwhile, the Fed’s modest balance-sheet expansion ($20–$25 billion in monthly purchases) is a far cry from pre-2008 quantitative easing, doing little to ease upward pressure on long-term yields.
Third, fiscal fears are creeping in. Projections show U.S. debt could hit 120% of GDP in a decade, fueling a “supply-side premium” that’s pushed 9–10-year forward rates to the 85th percentile of historical risk premiums since 1971. In plain terms: investors are demanding higher returns to hold long-term U.S. debt, worried the government may struggle to pay it back.
What Does This Mean for Markets? Key Impacts
The 4.18% yield and inverted curve aren’t just abstract numbers—they’re rippling through economies and portfolios:
- Recession risk is front-and-center: Historical models link 2s10s inversions of this depth (-190 bps) to a recession within 12–18 months. The curve hasn’t steepened (a sign of imminent Fed easing), so that risk lingers.
- Corporate borrowing costs could rise: Higher long-term yields make it more expensive for companies to issue bonds or take loans, squeezing profit margins if inflation stays above the Fed’s 2% target.
- Savers win—sort of: While long-term bond yields are high, short-term rates (like savings account yields) remain low, creating a “yield curve squeeze” for everyday investors.
- Global bonds are on edge: U.S. yields set the tone for global markets. Higher rates here could attract foreign capital to U.S. assets, pressuring emerging markets and their currencies.
What’s the Fed Doing—and Where Are the Gaps?
The Fed’s playbook is clear: fight inflation with high rates, even if it risks a downturn. But there are cracks in the strategy:
- Policy signal vs. market reality: The Fed’s “no-cut” rhetoric is working—markets now price in zero rate cuts in 2026—but the inverted curve is screaming “recession.” The Fed hasn’t addressed this disconnect.
- Fiscal vs. monetary policy: The Fed’s balance-sheet expansion is tiny compared to 2008’s QE ($1.3 trillion target vs. $4 trillion then). Meanwhile, the Treasury’s $2 trillion annual short-term issuance is flooding the system, limiting the Fed’s ability to ease liquidity shortages.
- The “unknown unknown”: If inflation drops below 2% quickly, the Fed could pivot—but right now, there’s no catalyst for that. The result? Yields are stuck at elevated levels, with no clear exit.
Short-, Medium-, and Long-Term Outlook: What to Watch
The path ahead depends on three variables: Fed policy, inflation, and fiscal responsibility. Here’s the breakdown:
- 0–6 months (Short-term): Yields will hover near 4.18%, with minor swings driven by auction results and CPI reports. The 2s10s spread will stay below -150 bps, keeping recession fears alive but no closer to a rate cut.
- 6–24 months (Medium-term): If inflation stays above 2%, yields could hit 4.5% by late 2027. A widening federal deficit would deepen the inversion, pushing the 2s10s spread to -220 bps—and triggering a “risk-off” shift for investors.
- 3–5 years (Long-term): Normalization is possible if GDP grows above 2% annually and the Fed’s balance-sheet efforts ease liquidity strains. Then, 10-year yields might retreat to 3.5–3.7%, and the 2s10s spread could flatten to -50 bps—closer to historical “normal.”
The Bottom Line: Yields Are a Compass, Not a Crystal Ball
The 4.18% yield on 10-year Treasuries is more than a number—it’s a snapshot of a Fed prioritizing inflation over growth, markets pricing in uncertainty, and investors forced to choose between risk and reward. For now, stability is the theme: yields aren’t spiking, but they’re not falling either. The real story, though, is what comes next. Will the Fed blink first? Will fiscal policy spiral out of control? Or will the economy defy the inversion and grow?
For investors, the answer lies in two metrics: the 2s10s spread and the federal debt-to-GDP ratio. Watch them closely—they’ll tell you everything you need to know about whether the bull market in bonds is over… or just taking a breather.
🚨 $1,000+ Tariff Cost Per U.S. Household in 2025: Most Since 1993, Report Finds
Shocking new data: U.S. households faced $1,000+ in tariff costs in 2025—the most substantial tax-like burden on American consumers since 1993 🚨 Nearly 94% of tariff dollars were passed directly to end-users, driving up coffee prices 33.6%, new cars by $5,700, and eroding real purchasing power even as GDP grew 4.3%. The tradeoff? $264B-$287B in fiscal revenue—but for U.S. families, especially those buying electronics, apparel, or food: How has this tariff burden hit YOUR monthly budget? — American consumers
A February 15 report from the Federal Reserve Bank of New York (FRBNY) delivers a stark verdict: Trump-era import tariffs cost the average U.S. household $1,000 in 2025—and that bill will climb to $1,300 in 2026 if policy stays the course. With a 94% pass-through rate of tariff costs to consumers, the burden ranks as the largest tax increase on American families since 1993, according to the FRBNY and Tax Foundation analyses.
How Tariffs Took Hold: A Rapid Rise in Rates
Tariff rates didn’t creep up—they surged. From 2% in early 2024, effective rates hit 10% on average in 2025 (the highest since 1946) and peaked at 13% by December 2025 for targeted goods like electronics, furniture, and automobiles. Analysis of 25 million shipment records (valued at $4 trillion) confirms tariffs were rarely absorbed by businesses: 94% of duties were passed to consumers in January–August 2025, edging down to 86% by November as exporters and importers made minimal margin adjustments.
The Real Impact: Price Hikes, Eroded Power, and Inflation
Tariffs don’t just affect trade—they hit dinner tables and wallets:
- Everyday Groceries and Goods: The Bureau of Labor Statistics (BLS) tracks sharp spikes: coffee up 33.6%, ground beef 19.3%, romaine lettuce 16.8%, and frozen orange juice 12.4%. Non-essentials fared worse: apparel/leather goods rose 34–36%, while new cars added $5,700 (a 9% jump) to sticker prices.
- Purchasing Power Drain: The $1,000 2025 cost equals cutting annual non-essential spending by 3–5% for middle-income households. The 2026 projection ($1,300) would deepen that squeeze, forcing trade-offs between basics like food and discretionary items.
- Sustained Inflation: Tariffs contributed 0.3–0.5 percentage points to the 2025 Consumer Price Index (CPI) rise of 2.7%—even after accounting for monetary policy and supply-chain fixes. This isn’t fleeting: it’s a steady drag on price stability.
Strengths, Weaknesses, and Risks: The Tariff Trade-off
The policy has mixed outcomes:
- Strengths: Tariffs generated $264–$287 billion in 2025 fiscal revenue (0.5% of U.S. GDP) and signaled trade assertiveness.
- Weaknesses: They directly inflate consumer prices, erode real wages, and shock sectors like apparel (where 60% of costs now stem from tariffs).
- Threats: Ongoing litigation over the International Emergency Economic Powers Act (IEEPA) could invalidate duties, while sustained price pressure might stoke broader inflation expectations—dampening consumer confidence just as the economy shows resilience (Q3 2025 GDP grew 4.3%, unemployment held at 3.7%).
What’s Next: Short, Medium, and Long-Term Projections
- 2026 (Short-Term): Household costs will likely hit $1,300–$1,500, with pass-through stabilizing near 90%. High-tariff categories (apparel, electronics) could see 15%+ year-over-year price increases.
- 2027–2028 (Medium-Term): No policy change means tariffs stay around 12–13%, but import volumes may drop 2–3% annually, slightly reducing fiscal revenue as businesses shift to domestic or tariff-friendly suppliers.
- Post-2028 (Long-Term): Supreme Court IEEPA rulings could slash duties, cutting household costs—or persistent tariffs might shrink U.S. import share below 10% of global manufacturing, reshaping consumption patterns for decades.
The Bottom Line: Tariffs Are a Household Tax, Not Just Trade Policy
The data is unambiguous: tariffs are not a “tool” for trade wars—they’re a tax on American families. While the federal government gains billions, households are paying through higher grocery bills, bigger car loans, and less money for savings or leisure. As policymakers weigh trade strategy against economic pain, the $1,300 2026 projection isn’t just a number—it’s a reminder that every tariff dollar collected comes directly from someone’s pocket.
In Other News
- U.S. Customs Bond Insufficiencies Surge to 27,479 in Fiscal 2025 Amid Trump Tariffs
- U.S. GDP Growth Holds at 2.9% in 2023, Reinforcing Soft Landing Narrative
- U.S. Inflation Cooling but Beef Prices Hit Fresh Record Amid Cattle Shortage

Comments ()