China Outpaces U.S. in Science Output by 45%: Corporate Investment Surges as Federal Funding Stalls
TL;DR
- China Surpasses U.S. in Nature Index Research Output with 32,122 Shares in 2024
- Fed Sells $54B in 10-Year Treasuries at 4.18% Yield Amid Rising Debt and Yield Curve Shifts
- Copper Mining Stocks Surge as Electrification Demand Outpaces Supply, Driving Record Investment
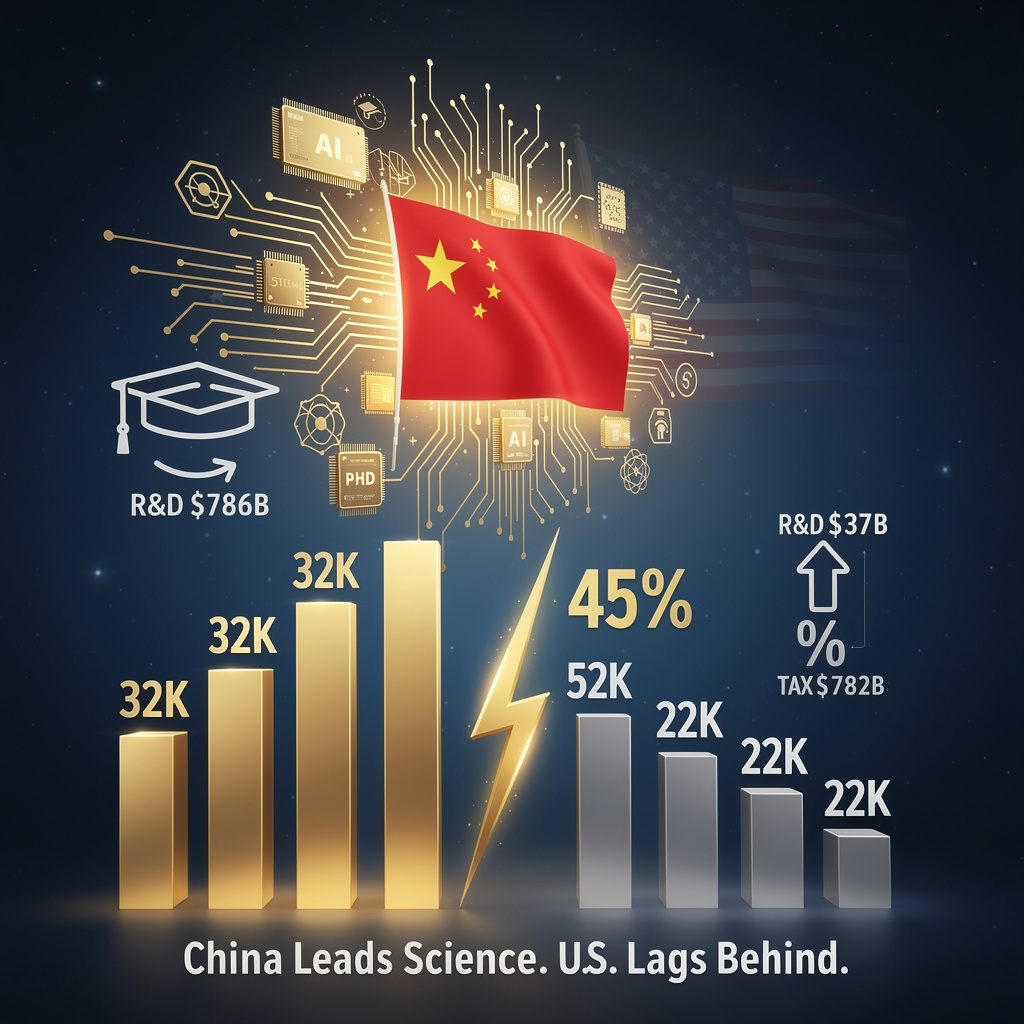
🇨🇳 China Surpasses U.S. in Scientific Output: 45% Lead in Nature Index Shares Amid R&D Shift
China just outpublished the U.S. in top-tier science by 45% — 32,122 vs 22,083 Nature Index shares — equivalent to adding 5,590 more breakthrough papers in a single year. 🇨🇳 While U.S. federal R&D funding stagnates, Chinese corporate investment surged 537% since 2014. The gap isn’t just spending—it’s momentum. Who loses when the next AI or quantum breakthrough is made in Beijing, not Boston?
China’s labs produced 32,122 high-impact research “shares” in 2024, eclipsing the United States’ 22,083 and flipping a decades-old ranking. Beijing’s 17 % surge in the Nature Index coincided with Washington’s 10 % slide, the first time the gap exceeded 45 %. Behind the numbers: $786 billion of Chinese R&D spending—$4 billion more than the U.S.—and a 537 % decade-long jump in corporate research budgets.
How did Beijing sprint ahead?
Central planners front-loaded grants into AI, quantum hardware, and advanced materials, then paired them with tax incentives that pushed private-sector R&D from 9 % of the global corporate total in 2014 to 25 % in 2024. Eighty-two percent of Chinese Academy members now earn their highest degree at home, keeping discovery pipelines domestic. U.S. firms, meanwhile, saw their global share slide from 40 % to 22 % while federal agencies such as NIH faced White House accusations of “broken trust,” slowing grant cycles.
What the shift means—now
- Innovation leadership: China’s 45 % lead in high-impact papers positions it to set standards in AI chips and quantum encryption.
- Talent magnetism: Domestic PhD retention narrows U.S. access to top Chinese minds, reversing historical brain-drain.
- Patent leverage: More first-authored discoveries feed Chinese patent filings, raising royalty costs for U.S. firms.
- Budget signal: Parity in total R&D outlays ($786 bn vs. $782 bn) shows money, not just volume, has moved.
- Peer erosion: Europe and Japan also lost 9–11 % of adjusted shares, amplifying Beijing’s relative clout.
Where Washington stands—and stumbles
Observed:
- 2025 White House budget proposes NIH transparency fixes but adds only marginal R&D funds.
- Corporate R&D tax breaks remain at 2020 levels while China expands credits 13 % annually.
Recommended:
- Inject $50–70 bn yearly into fundamental science focused on AI, quantum, and materials.
- Offer matching credits for any U.S. firm that raises research intensity above 8 % of revenue.
Timeline: three horizons
2025–2026:
China’s share expected to tack on another 3–5 %; U.S. slips 2–4 % without stimulus.
2027–2029:
Beijing likely tops $800 bn R&D; Washington flat at ~$770 bn under current caps.
2030–2034:
If trajectories hold, China could command >35 % of high-impact publications and >30 % of global R&D, cementing technological leadership across multiple strategic sectors.
Bottom line
The 2024 Nature Index marks more than a statistical swap—it signals that sustained funding, private capital, and talent retention can redraw the global science map in a decade. Absent a coordinated U.S. surge in federal and corporate research, yesterday’s innovation superpower risks becoming today’s second-place subscriber to Chinese breakthroughs.
📈 4.18% 10-Year Yield Hits Record High — $54B Treasury Auction Sparks Fiscal Risk Alarm in U.S.
4.177% yield on $54B Treasury auction — the highest in months 📈 That’s $2.2B extra in annual interest just on this one sale. While the Fed quietly buys $20B/month, it’s drowning in $766B weekly debt issuance. Foreign buyers still step in — but for how long? Are U.S. taxpayers paying the price for endless borrowing?
The U.S. Treasury sold $54 billion of 10-year notes at 4.18 % on 15 Feb 2026—the highest yield in months—while federal debt jumped $701 billion in a single week, pushing the outstanding total toward $31 trillion. Investors still bid aggressively, yet the 4.177 % closing yield and a widening 2-year spread (widest since Jan 2022) indicate the market is now pricing a lasting premium for Washington’s ballooning IOUs.
How the auction mechanics moved the curve
- Supply shock: the 10-year tranche is only one slice of $766 billion in Treasuries offered this week, keeping aggregate monthly issuance above $2 trillion.
- Curve twist: 10-year yields rose 6 bps while 30-year yields slipped to 3.75 %, flattening the long end and steepening the 2- to 10-year segment—classic signal that traders expect short rates to stay elevated.
- Fed offset: the Federal Reserve’s newly announced $20–25 billion monthly bond purchases for reserve management are too small to absorb the extra supply, leaving the market—not the central bank—to set the clearing price.
What the 4.18 % yield changes for everyone
Federal finances: every 10 bp on the 10-year adds roughly $550 million in annual interest on this week’s issue alone; roll the entire stock of maturing notes at today’s rate and debt-service costs climb by tens of billions.
Corporate funding: investment-grade issuance is already tracking 8 % above 2025 levels; higher benchmark yields feed straight into loan coupons, squeezing margins for capital-heavy sectors such as utilities and telecoms.
Mortgage market: the 30-year fixed rate shadows the 10-year; at 4.18 % plus a typical 170 bp spread, new home-loan quotes near 5.9 %—enough to shave ~7 % off median affordability, cooling spring selling-season momentum.
Bank earnings: a steeper 2-10 curve can widen net-interest margins, but if deposit costs re-price faster than long assets, the benefit evaporates; regional-bank stocks underperformed the S&P 500 by 210 bps post-auction.
Policy response and the remaining gaps
- Treasury is front-loading bill supply ($541 billion maturing in 4-26 weeks) to bridge cash-flow mismatches, yet has not outlined a durable plan to slow gross issuance should yields keep climbing.
- Fed officials say balance-sheet growth is purely for “reserve management,” not stimulus; markets therefore expect the FOMC to rely on the policy rate, currently >4 %, to anchor expectations—leaving bonds exposed to supply dynamics.
- Gap: no contingency for rollover risk if foreign demand—Japan ($1.2 trillion) and Canada ($472 billion) are top holders—softens on currency-hedge costs or geopolitical tension.
Outlook across three horizons
Q2 2026: 10-year yields likely oscillate 4.15–4.25 %; auction calendar shows $50–60 billion per cycle, so supply pressure persists.
2027: if weekly debt growth stays >$700 billion and Fed purchases hold at ~$25 billion/month, yields drift toward 4.30–4.40 %, raising the capital-market reference rate for corporates and households.
2028: debt-to-GDP projected >120 %; political window for fiscal consolidation may open, but without legislative action the market could impose its own discipline via still-higher risk premiums.
Key takeaway
The 4.18 % print is more than a cyclical high—it is the market’s invoice for $31 trillion of federal debt, delivered while the Fed stays on the sidelines. Until either issuance slows or a bigger buyer emerges, borrowers across the economy will keep paying the tab.
⚡ $14,000/Ton Copper: Supply Crisis Hits Electrification Push — Chile, U.S. Miners Under Pressure
Copper prices just hit $14,000/ton — a 40% surge since August 2025 — enough to power every EV in the U.S. for a decade. With global inventories down to just 10 days of demand and new mines taking 4+ years to permit, the supply gap is widening. Southern Copper’s $20B expansion can’t keep up — and Chile’s output just dropped 4.5% YoY. Who bears the cost when the metal that electrifies the world runs short? — miners, consumers, or policymakers?
Copper futures have climbed 40 percent since August, pushing spot prices past $14,000/ton, while exchange inventories cover barely ten days of global demand. Southern Copper, Freeport-McMoRan, and Hudbay Minerals are attracting record institutional inflows—yet short interest on SCCO has still doubled to 10.5 million shares, underscoring doubt that miners can deliver new metal fast enough.
How the supply trap works
Electrification—EVs, data-centers, grid upgrades—will add ~4 Mt of annual copper demand by 2030. New tier-one projects face 2-4-year permitting plus water-rights negotiations; average ore grades are falling 16 percent year-over-year, forcing 16× more energy per ton. Chile, source of 24 percent of world supply, saw December output dip 4.5 percent, and only 13 percent of consumption is met by recycling.
Impacts at a glance
- Price tension: 40 % futures rally compresses inventories to 10-day cushion.
- Equity surge: SCCO +132 % YTD; FCX posts four consecutive EPS beats.
- Cost inflation: 16× energy/unit and 2× water use erode future margins.
- Short skepticism: 4.9-day cover ratio signals traders expect volatility even at cycle highs.
Response & gaps
Observed: SCCO commits $20 bn through 2027; Tía María 24 % built, $1.3 bn already spent.
Missing: No tier-one mine is slated to start before 2029; permitting backlog unchanged.
Outlook
2026: Copper stays >$13,500/ton; sector CAPEX hits $25 bn; EV sales +15 % tighten scrap availability.
2027-28: SCCO expansion adds ~300 kt/yr; deficit narrows but remains >250 kt.
2029-31: Two new mines could balance market; if not, sustained $14,000+ price required to ration demand.
Bottom line: electrification has outrun geology and red tape. Shareholders are front-running a decade-long supply crunch; whether miners can convert record spending into fresh concentrates will decide if the red-metal boom is priced for perfection or still a bargain.
In Other News
- US Trade Rebalancing Accelerates as Dollar Drops 10% and Investors Shift to International Equities
- Tesla US Sales Fell 17% YoY in January 2026 Amid EV Market Contraction
- U.S.-India Trade Talks Stall as India Continues Russian Oil Purchases Despite U.S. Sanctions
- Beef Prices Hit Fresh Record as US Inflation Cools, Fueling Consumer Strain

Comments ()